(ENG/ESP) Steemit Crypto Academy Contest / S15W2: Stock to Flow Model || Modelo Stock to Flow
🔥Explain in your own words the Stock to Flow Model, what is its function?
🔥What would be the advantages and disadvantages of the Stock to Flow Model?
🔥Make an analysis of the Stock to Flow graph,
https://www.lookintobitcoin.com/charts/stock-to-flow-model
🔥Can this model be applied to STEEM? Give reasons why this Stock to Flow graph model can or cannot be applied.

From Canva
The first thing that comes to my mind whenever I hear or see Stock, is financial asset and their value and their use case. A Stock-to-Flow model is a influencial finance concept mostly used in the financial ecosystem which uses a mathematical theory or calculation to easily analyze the financial assets, high valued commodities and even cryptocurrencies.
Just like Bitcoin the technique was designed by a famous anonymous analyst popularly known as "PlanB,", Stock-to-Flow model has grown so important and very famous including in the crypto ecosystem. To understand its function, we must delve into the key components and assumptions that underpin this model.
The Stock-to-Flow ratio is a very significant and easy going aspect of the Stock-to-Flow model, that technically compares data of the of an existing asset to. The data from its annual production or recreation which is also popularly
called Flow. The most famous and efficient formula used to calculate the Stock-to-Flow is as below:
Stock-to-Flow = Stock / Flow.
This formula could be used check how scares a product or asset is in the market over a period of time by marking how much time it would take the producers and miners to reproduce the current or exiting amount of asset in the market.
Historically, the Stock-to-Flow model has been used on assets like diamond, gold and silver etc. These highly valuable asset which are known for the awesome Stock-to-Flow ratios, which proves that there are very scarce and that's why they are really valuable and appreciated. As we're all know the scarcer gold, silver and diamond are the better their value and appreciation increase in the market.
Stock-to-Flow has really benefited from the famous cryptocurrency influence, infact it's believed its growth is inspired from its relationship with Bitcoin in recent times, in the crypto he crypto ecosystem.
Stock-to-Flow Is used to analyze the mining rate, most especially in Blockchain like Bitcoin that always keeps track it's totally supply, infact I believe this technique also added as source for approximating bitcoin halving event every four years, because it can help in calculating the time to print 21 million bitcoin total supply with the new mining rate .
When it comes to crypto asset such as Steem, Bitcoin or Ethereum, while using Stock-to-Flow they Stock is always equal to the total supply of the crypto asset while the Flow is equivalent to each newly printed assets. Whenever a crypto asset supply is lower, so therefore the Stock-to-Flow would grow higher.
🔥Price Prediction:
The core reason why the traders uses Stock-to-Flow model is to help create a structural data used to safely analyze the price movements of stock asset and cryptocurrencies, like Bitcoin. What traders do is that the checkout asset the higher asset because using Stock-to-Flow model higher the Stock-to-Flow the scarcer it becomes in the market, so therefore there are higher chances the are very valuable and trustworthy to invest in.
🔥 Analysing Scarcity in the market:
Another basic duty of Stock-to-Flow is to help traders or investors easily calculate amount of scarcity of an a stock asset like +Gold, Silver or diamond etc) and crypto assets like Bitcoin, Ethereum and Steem etc) by comparing the total supply of the asset at that time, to the annual production also called FLOW. So therefore the higher the Stock-to-Flow, the more they asset get scarce in the market.
🔥 Analysing value of asset in the market:
This model is really admired because it is good in generation of the maximum value of an asset, it could be used to calculate the value of the asset, therefore relieving investors the stress of guessing the the value of an asset the want to invest in. One can easily detect when an asset is also devalued at a period of time, so therefore helping trading invest in the best time to generate profits.
🔥 Influence in halving event:
If you have been following my post recently I said something similar to this this model is very powerful and has a hand in helping the Bitcoin team organized the upcoming bitcoin halving event, this one reason the time period given for each bitcoin halving seems very accurate this model helps tell the team at which particular year Bitcoin would hit another 21 million total supply by taking data from the existing total supply and comparing it with the rate in which a new bitcoin is mined.
🔥 Enhance Crypto Education:
It might come to as a surprise to you to know that not all people or individuals who use this model, use them to trade or make investment but I'm here to tell you that even some professor oh highly intellectual people like educational experts, use this model to create educational post or books that could enlighten or educate people more on the scarcity and total supply of stock assets and crypto assets
.png)
Despite the fact that this model has proven to be very effective and efficient to traders, investors, educationalist and other types of individuals out there who have used this model in one way or in the other, this model just like other powerful tools has so many advantages that makes it outstanding and useful and at the other hand with also has disadvantages which are the downside of making use of this Stock-to-Flow model
✅Historical Data usage:
This Stock-to-Flow model unknown for it remarkable ability to generate historical data that could be used to simply analyze future data or price movement of an asset whether it is stock access or crypto asset, this is a very awesome advantage because it could help you generate maximum profit from trades and investment just like in the case of Bitcoin whereby historical data are what give traders confidence to place more investment in Bitcoin before it's halving.
✅ Price Analysis:
Another very vital and reliable reason why both trader, investors and even educationist, uses this technique or should I say model when analyzing the market whether crypto market and Fiat market, the ability of the model to easily effectively and efficiently physics price movement of crypto assets and stock access over a period of time to help maximize profits of investors, traders and learners.
✅ It's Ability To Adapt
Because of the quantity of data and information extracted from the stock market and that of the crypto market, this model was developed with a soul aim of adapting to any amount of information and data so therefore causing the team to produce higher versions that can adapt to any size of data and information at any period of time.
❌ Data Dependence:
This model which is known for his powerful ability to perform wonderfully generate it data and information from sources so therefore the sources of this data has a high impact on the accuracy and trustworthy the output we might receive. That's to say if the source or data about the total supply is wrong or the printing/mining rate is wrong the errors in the outcome or output are inevitable.
❌ Ignoring External Data
This technical model although being very powerful efficient and effective in analyzing and predicting the upcoming movement in the market weather stock or crypto, has a big disadvantage which is that pay model tends to ignore external factors like fundamental news that has higher influence in the stock market and crypto market.
❌ More effective in bigger assets:
Although this Stock-to-Flow model is highly effective on big asset and very valuable assets like the Bitcoin gold silver and diamond, because their scarcity usually generate high buy pressures and their trends usually affect the general state of the market at that period of time. But there are some assets who don't focus on their scarcity to become valuable and very profitable. This sort of asset that don't focus their energy on their scarcity tends to give more of inaccurate data and information when this model is employed into them.
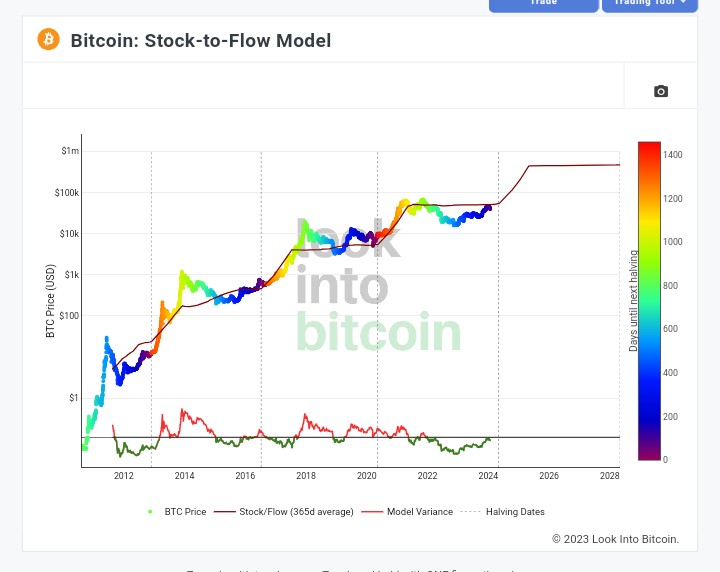
Luckily for us Stock-to-Flow model is a very easy model because it was developed to be very feasible and with the best user interface, the information on the models were labeled in the best terms. That's is to say every diagram or line on the model were explain in full English words (no abbreviations) to explain words.
Horizontal lines on the left are used to represent the price data of Bitcoin yearly, the data raged from value 0 to value $1 million, which we expect Bitcoin to reach in the year 2030 and also the chart shows that Bitcoin might hit $100k in the year 2025 that is if the Bitcoin continues to grow continuously and consistently over that period of time.
The lower vertical line on the chart shows the time interval and date in which this significant growth on Bitcoin occured on the crypto ecosystem, this date are used to compare the prices movement of the asset.
The dotted horizontal lines on the chart starting from the dates on the vertical line are used to easily mark the halving dates each year on the bitcoin ecosystem, if you notice they are significant changes after each halving event on Bitcoin blockchain platform.
While the multi colored bar at the right side of the chart acts as a bitcoin halving timer, it's used to tell how much time is remaining before the next bitcoin halving event . For example if you see the chart well you notice the color of the candlesticks is currently dark blue, showing there is less than 200 days before the next halving events. Also immediately after each dotted line there are dark red ♥️ candles stick looking line, then the turn yellow 🟡 before turning green before it reach blue 🔵.

I would say No, although some may think yes, there are so many reasons why I chose no and below 👇 are some credible reasons.
This Stock-to-Flow model are very awesome model, that is best used for very big, scarce and powerful asset like Gold Silver and Platinum in the stock market and Bitcoin and ethereum on the crypto market, because of the format in which its analyzed and used by traders and investors in stock market and crypto market.
This models make shows halving date of and asset using horizontal dotted line, so therefore it full potential would be shown in assets that experience halving and we all know that the Steem blockchain have not held any halving in the Blockchain. So therefore using this model to analyze Steem with disable this feature, which we know is not a good practice for trading in the crypto ecosystem.
The candle like lines that act as an intersect between the horizontal Bitcoin Price and the vertical line containing the dates are coloured according to the closeness of the upcoming Bitcoin halving event. if Steem uses this mode, what colour would the line turn to? The answer would be difficult because steem don't expect anything related to halving in coming years.
The Stock-to-Flow model is a very interesting model that can give you very credible knowledge and information about the historical data from Bitcoin or any asset you wish to analyze, although it's advised you use it for scarce assets like Gold, Silver, Platinum Ethereum and Bitcoin to help traders make very feasible profit from trading
Thanks for going through remember starrchris cares ❤️
Greetings, my friend @starrchris! Your breakdown of the Stock-to-Flow model is outstanding—it's impressive how it predicts market trends. Your insights on applying it to STEEM show a keen understanding. All the best in the contest, success for you! 👍
I am glad my post seems useful to you, I must say it must be a pleasure.
Thank you, friend!


I'm @steem.history, who is steem witness.
Thank you for witnessvoting for me.
please click it!
(Go to https://steemit.com/~witnesses and type fbslo at the bottom of the page)
The weight is reduced because of the lack of Voting Power. If you vote for me as a witness, you can get my little vote.
Thank you very much friend, I appreciate 🙏😊
Really love to read your post specially "price prediction and external data for Halving and Stock to Flow to understand its algorithm is very impressive and informative to me and all of us in this community.
Hey dear friend give me ultimos pride our confidence whenever I see such amazing comment on my article especially when it comes for a highly intellectual individual like you. Thanks for going through my post, I appreciate
My pleasure 😊
God grant you success
These concept to my sense is broad,
Applying mathematical concepts to pretty understand well the market possible prediction is massive.
Looking at what you've written so far, it'll prompt me to calling you a crypto guru.
The ease given to easily analyze market and determine the mining ⛏️ rate on coin like gold and Bitcoin is awesome.
I so love 💖 this concept though it comes with some disadvantages of not possibly involving all data to get the perfect result but indeed it helpful to most traders.
I love your presentation
Good luck 🤞 sir and I'll love to read more from you.
You can also explore my context, I've participated.
Hahaha thanks for your nice compliment on my article it made me laugh when you called me a crypto guru, that means you really appreciated and enjoyed my article because my major goal thanks for sharing, wishing you success
Thanks boss your comment is really enticing and delicate. I appreciate your kind comment
@starrchris Really enjoyed your detailed breakdown of the Stock to-Flow model. Its fascinating how it applies to various assets especially in the crypto space. Your explanations were clear and I appreciate the insights. Best of luck in the contest
It's so lovely to hear that my article is really outstanding to you, I am already blushing already 🥰
@starrchris
You explained us very well in this post and gave a clear example that you gave about Anonymous who developed a tool to determine the value of Bitcoin called the Stock-to-Flow Model. Also known as Plan B and the Stock-to-Flow model is a very advanced model that we can use to predict which direction the price of Bitcoin will go, up or down. But we can understand and estimate from this model by looking at it, by looking at its lines, by looking at its color, we can clearly infer that stock-to-flow is an important aspect of its model. Determinable means that its price can be determined Bitcoin price can be estimated and you clearly explained about the asset of the traders or if you talk about gold. And really understand what all these things are if the tool is developed by anonymous person, it is developed for the convenience of people and to know about this upcoming bitcoin future. It clearly shows us many things from 2009 to 2020 all his predictions have come true and your post is admirable indeed you have covered a great topic. And best wishes for the competition, God bless.
Wow this is such a powerful comment and it says a lot about about your good heart and hard work. Please keep it up bro
Thanks for explaining the Stock-to-Flow Model so well. Your explanation really made it easy for me to understand a concept that seems so complex at first. I appreciate how you shared both the advantages and disadvantages, giving me a well-rounded view.
But then,
I think that should be Dotted Vertical Lines. Good luck with the engagement challenge.
My real nigga, your comment on my post is a pleasure and honor, I really appreciate your good job and honest comments
Thank you brotherly.
You've provided a comprehensive overview of the Stock-to-Flow model, highlighting its significance in the financial ecosystem and its application to high-valued commodities and cryptocurrencies, including Bitcoin. Well articulated!
Awwn thanks for appreciating my content, I really appreciate your honest comment.
Upvoted! Thank you for supporting witness @jswit.
Thanks witness, you are doing a nice job.