Steemit Crypto Academy Contest / S14W5 : Exploring STEEM/USDT Trading
From Canva
As always before I start I really want to appreciate the team for such creative and powerful contest and also I want to thank the team for the sincere grading method and their dedication for the community. I really appreciate your good work.
.png)
The Moving Average Convergence Divergence (MACD) is a well known and trusted momentum based indicator used for technical analysing the crypto market to easily predict price movements the trend direction and basically momentum the trend moves and chances of price reversals.
Moving Average Convergence Divergence as the name implies any indicator known as a Divergence sometimes move in the opposite direction of the Japanese candlesticks and when this is seen traders are then expecting a trend reversal.
Moving Average Convergence Divergence is a very powerful indicator that requires high level knowledge of indicator before you can professionally use to generate benefits or profits effectively and effectively. Moving Average Convergence Divergence helps check the momentum of asset in the crypto market, infact this is one the basic reasons traders uses it.
• MACD Line:
This is the blue line below, it works hand in hand with the orange looking signal line easily seen below, it help in analyzing and predicting price trends, this is usually gotten by subtracting the shorter-term EMA by the longer term (EMA), so therefore making the MACD the result gotten from the subtraction between the longer term and shorter term EMA.
• Signal Line:
This is the orange line below, it works hand in hand with the blue looking signal line easily seen below, it help help in the analyzing and predicting of price movement, 9-period EMA of the MACD line.
• Histogram:
The histogram gives value for results the subtraction between the MACD line and the signal line, they usually move upwards and greenish in color during a bullish trend and the move downward and reddish in a bearish trend.
• Crossovers:
When the MACD line moves upward above the signal line, then there is higher chance of a bullish trend coming soon but when the MACD line moves, or cross downward the we traders expect a bearish trend very soon.
• Divergence:
As a Divergence indicator , this is another means of reading the MACD indicator, if the market is moving in the opposite direction seen on the MACD then there's a trend reversal coming. When the asset price goes bearish while the MACD forms shows higher high, then a bullish trend is expected otherwise the reverse is the case.
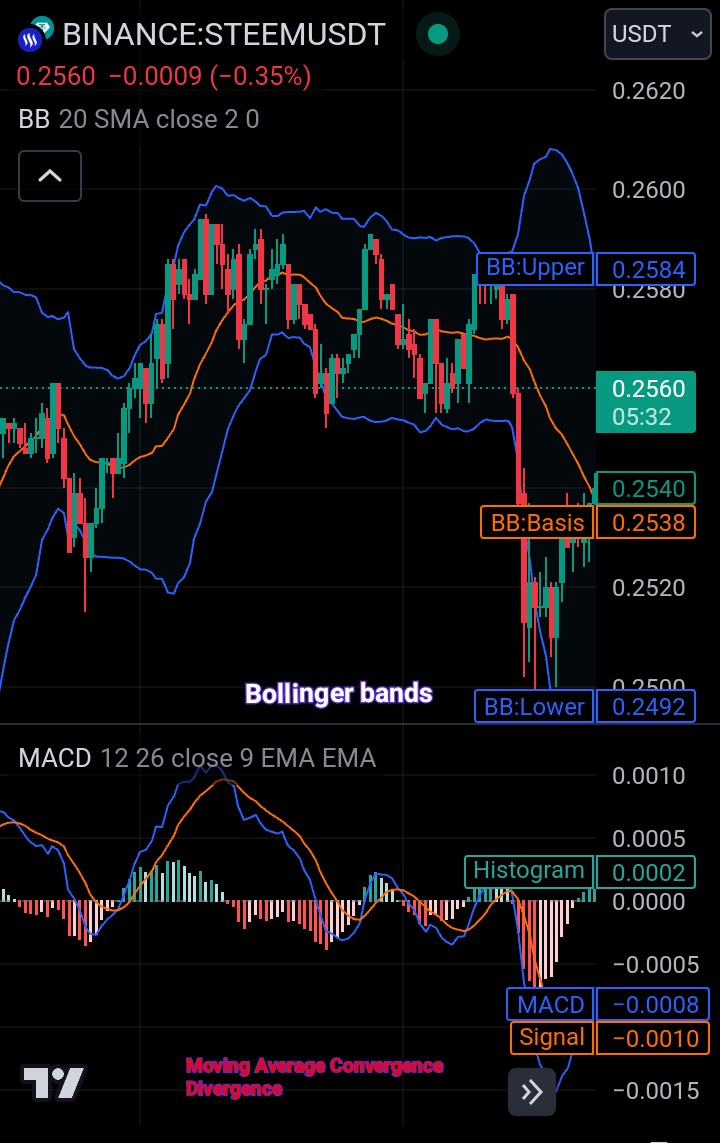
Image of Bollinger bands indicators and MACD indicator on Tradingview
• Histogram Analysis:
The bars of the histogram are what traders uses to analyze the market, the size and direction of the bars are very necessary in the prediction of price of asset. If they bars go upward and show green colors then we are seeing a bullish market and otherwise is a bearish market, also a thicker color means a stronger momentum and a lighter color means a weaker momentum.
The Bollinger Bands indicator was developed by trader known as John Bollinger the late 19s, is a volatility based a technical analysis indicator used to easily measure the volatility of the crypto market and easier find potential market trends in crypto markets. It's usually consist of three powerful bands.
• Middle Band (Simple Moving Average):
The middle line works as a base line that always support both the upper band and lower band, it is calculator using the famous mathematics standard deviation to efficiently analyse the price of the crypto currency,
• Upper Band:
The upper band is popularly used to detect when an overbought has occurred at a particular time due to higher buyers in the crypto market. Also whenever the candlesticks pass the upper band a price reversal is expected and a sell signal is close by.
• Lower Band :
The Lower band is popularly used to detect when an oversold is experience at a particular time due to more sellers in the crypto market. Also whenever the candlesticks pass the lower band a price reversal is also expected and a buy signal is close by.
• Compressing or Enlarged Upper Band And Lower Band:
Whenever the distance between the upper band and lower band is compressed, it means there is low volatility of the asset in the crypto market. Wherever the distance is enlarged that means there is higher volatility of the crypto market. At that moment in time.
• Overbought and Oversold Signal:
Whenever the candlesticks move above the upper band that means there's an overbought in the crypto market at that period and whenever the candlesticks move downward the lower band that means there's an oversold in the crypto market at that period.
A 15 min Steem/USDT timeframe chart, from my analysis the upper band and lower band are closer to each so therefore the Volatility is so low in the market and there's no overbought signals or oversold, then the MACD indicator is giving signals.
As you can see the MACD indicator histogram is thicker in color that means the momentum is getting strong and the histogram is shorter than before. Same way the candlesticks is testing the upper Bands, the MACD indicator line is trying to cross the signal line to generate a bullish trend.
In conclusion the sellers and buyers are fighting over who will dominate the market but they sellers would reign for a short period of time before the buyer finally takes control of the market.
The Relative Strength Index is a well known in the crypto ecosystem as one of the best trading technical analysis tool that works like with the famous momentum oscillator attributes used by crypto and forex traders to easily calculate and analyze the change in price of an asset over a particular moment in time.
Relative Strength Index (RSI) was founded and developed by a professional trader called J.W Wilder Jr, the Relative Strength Index (RSI) is also trusted to easily predict an overbought in the movement price of any coin or an oversold in the movement of price of any coin, and also gives reversals signals to traders.
Below is the mathematical calculation for the RSI technical Indicator:
• The Calculation for the Average Gain and Loss Calculation:
For the Calculation of the average gain in the
crypto market and the average loss over 14 days in the crypto market
The Average Gain: Which is the Sum total of all gains during up periods divided by the total number of period at that time
**Average Loss:** Similarly Average Loss calculated as the sum of losses during all the down periods divided by the number of periods at that time.
al: Average Loss,
slp : Sum of loss during the period,
np: Number of Periods,
rs: Relative Strengt
al = slp/np
• The Total Relative Strength (RS) Calculation:
The Total Relative Strength Index (RSI) : The best way to calculate of the the Relative strength (RS)at that period is by dividing the total average gain by the average loss in the crypto market.
ag/al
• The Relative Strength Index (RSI) Final Calculation:
RSI=100−( 100/1+rs)
**
• Predicting The Overbought And Oversold Signals: Relative Strength Index values is most times found in the range from 0 to 100 on the chart, so therefore any Relative Strength Index (RSI) seen or moving above 70 is calculated as an overbought in the price of the cryptocurrency, so therefore range there are usually potential chances of seeing a trend reversal for the cryptocurrency.
In a Similar case any Relative Strength Index (RSI) seen below 30 on the chart is concluded as an oversold signal, so therefore we are expecting there would be a chance of a price reversal going bullish.
• Trend Strength:
Also the Relative Strength Index (RSI) indicator as the name implies is used to help easily and safely the strength of the market. In most cases when there's movement above the range 50 a Strong price bullish trend is usually concluded while if the price moves below range 50 of the indicator a strong bearish movement is on the way
Moving averages are powerful indicators that analysis the price data by creating a using average price over a period of time, the moving averages help traders easily find trends and possible reversal points in the crypto markets. The moving average are of three types:Simple Moving Averages (SMAs), Weighted moving average and the Exponential moving average.
The basic difference is they ability give data accurately and faster. The Exponential moving average gives most recent data and information needed than any moving average while Simple moving average weigh all required data making it more accurate but slower in the provision of data.
The Exponential Moving Average (EMA) is a very powerful and efficient technical analysis indicator used to easily predict and discover trends in crypto markets, It is similar to the Simple Moving Average (SMA) but as I have said is more focused on the most updated or recent data.
• Speed: EMAs updates faster to new price changes when compared to SMAs be because that's their focus and strength over most indicators on the crypto market.
• Trend Identification:
They have very powerful and helpful whenever a trader needs to identify a friend and predict the fourth coming trend in the crypto market this makes them very essential to almost every crypto trader our there
• Support and Resistance Levels: EMAs can be used as to create support lines and resistance lines based on the trend at that period of time, that to say it act as support line in a bullish trend and acts the resistance line in a bearish trend.
• Legit Entry and Exit Points:
Crypto traders make use EMAs to easily find quality entry and exit signal for crypto trading. For example, a buy signal may be generated when the price crosses upward the EMA and entry is taken on the second confirmation candle sticks, a sell signal may be generated when the price crosses bearishly in the EMA and entry is taken on the second confirmation candle sticks.
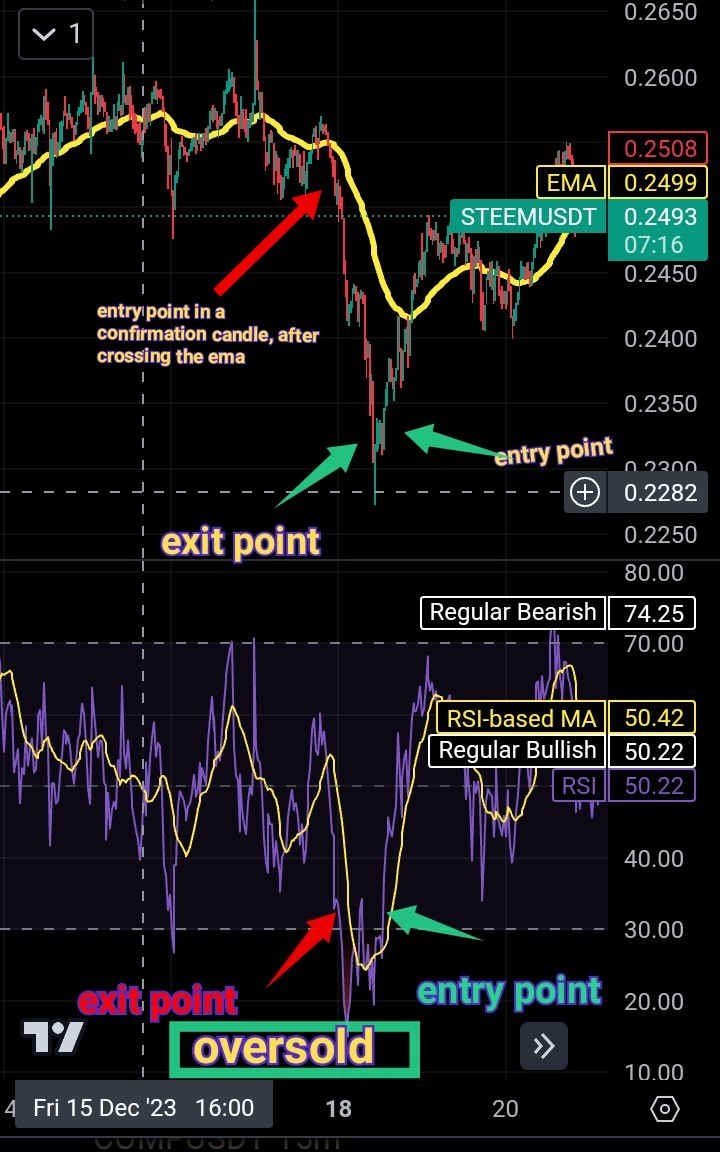
Above in the analyzed chat you will see two indicators one is the moving average while the other is for relative strength index the both were joined together to analysis steem .
As I have said before there is a high chance of a new trend whenever the price cross a 50 EMA and when price cross 70 or 30 in the relative strength index indicator, so therefore it's smart to find an entry after an over and oversold is seen because of the chance of a new trend. Its is not smart to enter immediately but to find a confirmation candle before hoping in the trend.
Stochastic Oscillator
I am not going to talk so much on Stochastic Oscillator because its similar to relative strength index indicator in fact the boat indicators are used for predicting same sort of analysis.
That is to say they both are used to check and overbought and oversold of a cryptocurrency using the crypto chart also with the use of the both line on the chat they could also at as confirmations to bearish trend or bullish trend.
The the major difference between the two indicators are the fact that Stochastic Oscillator is quite deeper in analyzing when compared to Relative Strength Index indicator and unlike the Relative Strength Index indicator that is measured using range 70 for overbought and range 30 oversold , they Stochastic Oscillator
Is measured from range 80 for overbought and range 20 oversold .
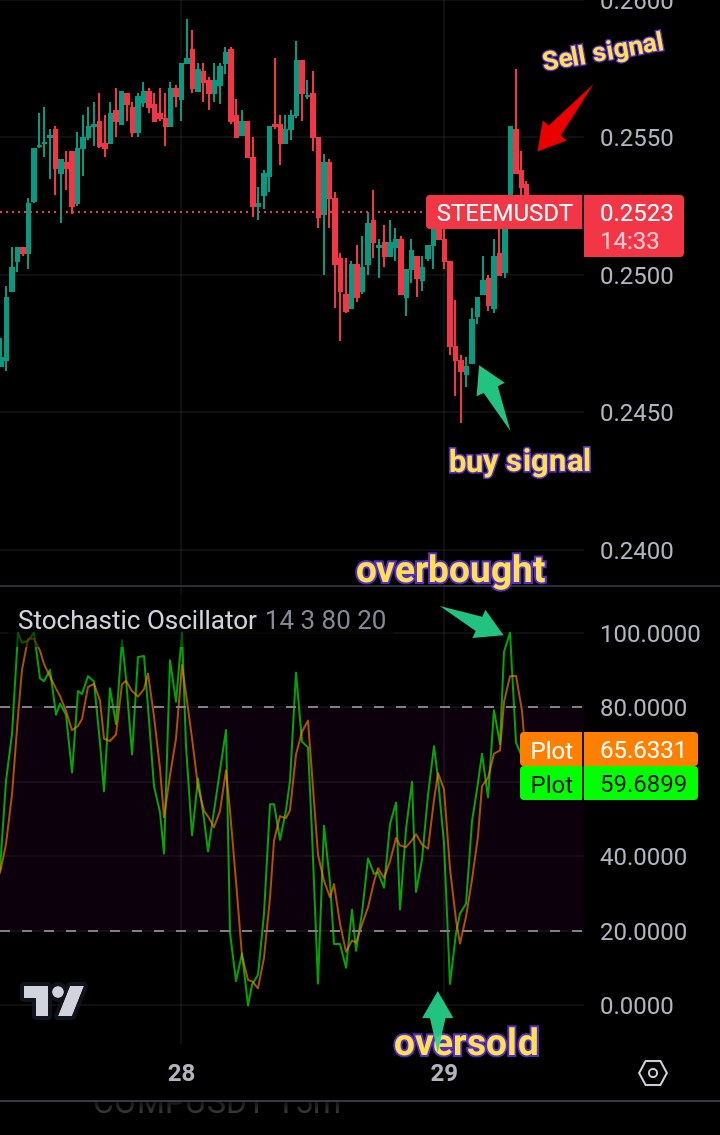
So from the chat we could see that the green light crosses the orange line below or around the range 20 of the indicator so therefore leading to a tremendous bullish movement or a buy signal, this is because the indicator was indicating and over sold and we all know that whenever there is an oversold there are high chances of reversal are leading to bullish trends
Similarly the indicator green light causes the orange line after they overboard signal which is seen above grade 80 of the indicator so therefore trend, so I have said before after an indicator signals an overbought they are higher chances of reversal causing bearish movement on the market. So therefore in conclusion the overbought Oversold and line crossing should be considered while analyzing the Stochastic Oscillator indicator
Just as Stop Loss is very vital and important whenever you are trading other crypto pairs stop loss is very vital while you trade STEEM/USDT on any crypto exchange. As the name is nice stop loss is an awesome future used in trading crypto trading to help reduce the chances of losing money or assets while trading or even if you lose your loss would be enjoyable because you have automatically set the worst case scenerio you can endure.
Stop loss is very important because even if you are currently not on your chart or you are currently busy stop loss would automatically help you cancel a trade when you have lose some amount of money or funds automatically.
It is smart of you as a trader to always ensure you put stop loss and take profit before placing any order this will really help easy easily manage your risk in trading cryptocurrency, this would help you get extra time to do other meaningful things you need to do without stress of standing on your chart or computer 24/7 to monitor your chat.
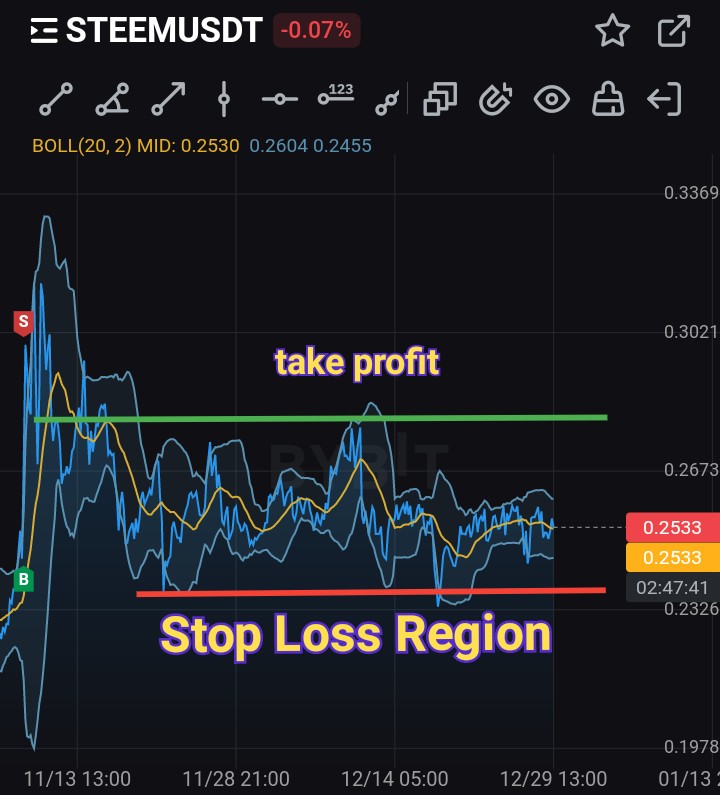
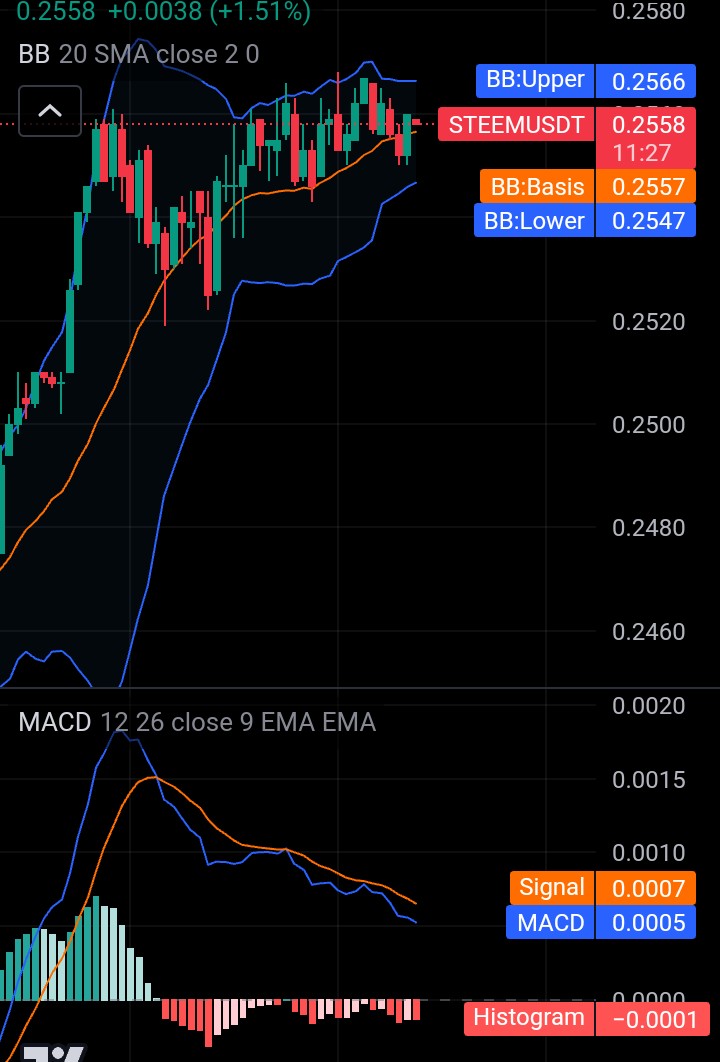
Left for me why placing my trade I do set my stop loss to 10% or at most 20% to avoid unnecessary loss due to selfishness or stinginess, on my chat you could see two strategies there. The first is the bollinger band and the second is the use of support line and resistant line to easily get my stop loss and take profit.
Using my bollinger band I could easily detected the overbought and oversold signals, also using my lines I could easily detect potential movement of the price. On the chat after eating my support line the price of the asset found back moving towards the resistance line creating a mini bullish trend.
So therefore my entry would be on the confirmation candle after the price bounced all my support line then my stop loss would be below my support line incase the price breaks the support line to create new lower lows. While my take profit would be somewhere closed to my resistant line before it might bounce on the resistance line to cause a bearish reversal.
Diversification is very important when you are trading cryptocurrencies especially STEEM/USDT pair to help reduce and easily the manage risk and increase larger trading profits. STEEM/USDT which is the trading pair for both our lovely STEEM, and USDT, the most famous stable-coin always pegged to to dollar price. Diversification is helpful in different ways and I would break it down in few ways below 👇:
• It helps in Risk Mitigation in a volatile market: Just like most crypto currency STEEM/USDT can experience very high price volatility, which is a normal thing in the crypto ecosystem. Diversifying would really help traders trading most especially trending market indicators because it would drastically reduce the effect or probability of losing totally despite the market outcome.
Also despite the fact USDT is a stable coins it can also be affected by inflation and deflation from external factors, this can cause and alter or affects the value and worth of a user asset or crypto currency but diversifying the trade would reduce the worth of any loss
• It can help improve ones profit in an order:It can generate extra profit from market of different types of market structures, despite the difference outcome, just imagine making profitable diversified trades the profit would be really interesting and massive. So therefore at this stage I would advise everyone who sees this post to try and make profit by diversifying their trades.
Fundamental factors or news are very vital sectors of trading, fundamental news or factors have to power to alter or change the trend of a market at a very short period of time, So therefore it is considered as a very essential aspect to look into before placing an order
Fundamental factors are very valuable information that could be as a result of new traders or new investors or a court case of an crypto exchange, this fundamental factors are news of latest development in the crypto ecosystem.
These fundamental factors are very powerful and they could either trigger a bullish trend or a bearish trend, the outcome depends in how they market may react to the news. For example the new Bitcoin price was triggered because of the latest ETF news and their outcome.

Source for crypto fundamental news
✓ Bitcoin Magazine ✓CoinDesk
✓BeInCrypto ✓Bitcoinist
✓CoinMarketCap. ✓Cryptolinks
✓Coingape. ✓Cointelegraph
Okay talking about how fundamental affect steam price in a crypto market recently before steam which is new high price which is 0.25 before then it was experiencing difficulty in a low price. Now before still got to this current price so many things triggered the bullish movement and one of that is fundamental news.
One of the factors that triggered the bullish trend was the fundamental used caused by crypto exchanges like bybit binance and other exchange that recently listed steem on their exchanges the news what new investors which now turn out to be holders or steem token to retain its current price and if possible go higher than it's current price.
In similar way any news concerning USDT or Bitcoin have higher chances of altering the current price of steem coin there for making it change from its current price, as we honor Bitcoin is one of the oldest coin in the market so therefore it have high power and chances to affect the prices of other coins in the market for example there is high chances of having a bearish market as soon Bitcoin experiences a down trend.
There are so many indicators out there that could also be used to calculate and predict or analyze the movement of steam 3 years existing easily above in my chat you could see two indicators: Fibonacci retracement strategy and KDJ indicator, these are very efficient indicator and i love to show you about it.
KDJ indicator also known as the Random Index indicator is a powerful indicator used to easily analyze and predict movement crypto asset in the market, the KDJ indicator helps produce trends signals and price movement signals. It is a very effective and efficient technical indicator which is known and trusted for it's good work.
KDJ indicator was a discovered using the Stochastic Oscillator Indicator but there is a small difference and that is the added J line. Whenever the %K line crosses the %D lines while going upwards, bullish trend is on the way. While otherwise would produce a downtrend.
Just like the stochastic oscillator when they reaches the range over 80 of they indicator then there's an overbought. Also just like the stochastic oscillator when they reaches the range below 20 of they indicator then there's an oversold. The J line is said to act as a divergence for line %D values.
Fibonacci retracement strategy
On the other hand Fibonacci retracement strategy was our last topic on crypto academy suggest for I'll be summarizing details about it, Fibonacci recruitment strategy which was derived from fibonacci mathematical sequence, is known for the ability to act as good support line and resistance line which in turn help detect retracement and reversal in the crypto market.
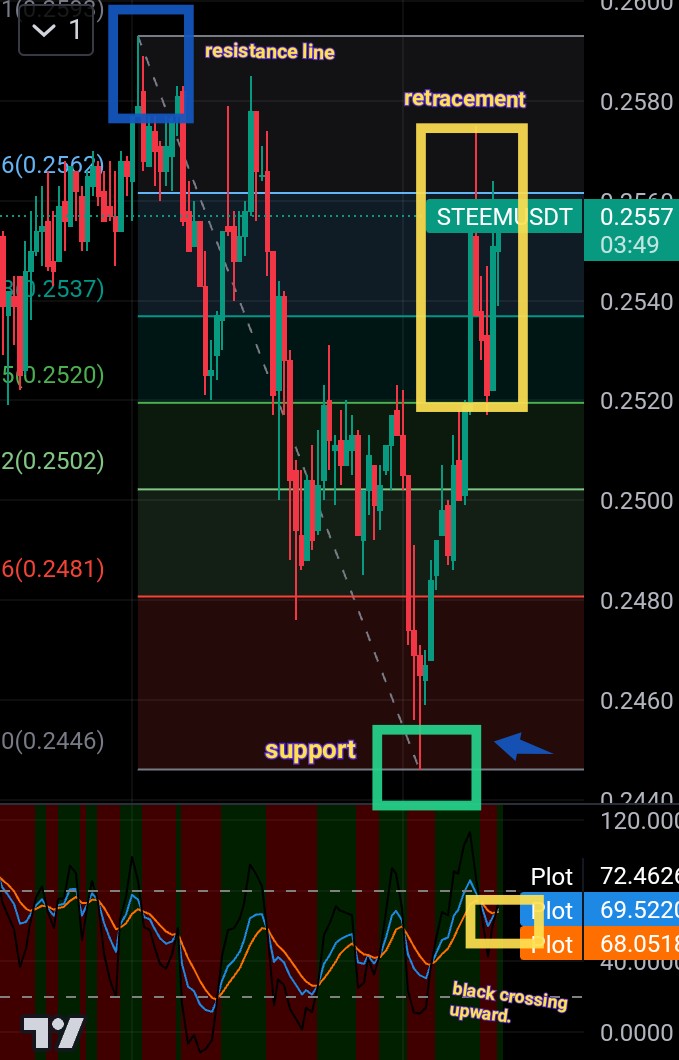
As you can see on the Fibonacci retracement strategy the price of steem coin is experiencing a retracement along the marked spot and hopefully a bullish trend is about to occur for at least a short period of time.
Then from our KDJ indicator we could see the %K line is about to cross the %D line going upward and if we you can remember vividly I said this is a sign of an upcoming uptrend. So therefore in conclusion or summary I would say there's high chance for a bullish trend for at least a short period of time, after as the line is about to cross and Retracement is looking strong.
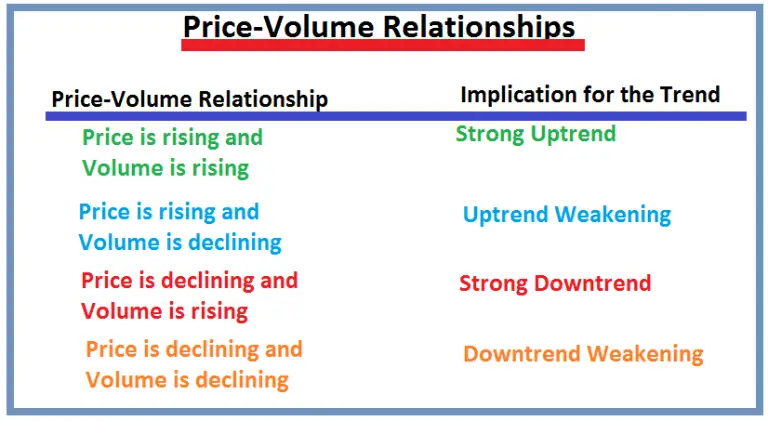
Most people don't know the volume of an asset can really help in the analyzing the future movement of the price, volume are very important and vital data that says a lot about a crypto currency and how it's succeeds over a period of time.
I would be explaining in easier terms and and methods, to help everyone fully understand the use of volume in predicting price of the asset. When the prices of STEEM/USDT is going upwards and STEEM volume is increasing, then there's a higher chance of seeing a bullish trend in the nearest future.
• In similar cases when the prices of STEEM/USDT is going downward and STEEM volume is decreasing, then there's a higher chance of seeing a bearish trend in the nearest future.
It may surprise you to know the volume of an asset can be used as a divergence when analyzing, at this stage you should be used to the word Divergence because I have used it numerously before now.
When the prices of STEEM/USDT is going upwards and STEEM volume is decreasing, then there's a higher chance of seeing a bearish divergence. That's to say the price of steem is going opposite ways with the volume of steem then a bearish divergence is upcoming.
When the prices of STEEM/USDT is going downward and STEEM volume is upwards, then there's a higher chance of seeing a bullish divergence. That's to say the price of steem is moving in opposite ways with the volume of STEEM then a bullish divergence is upcoming.
After making this entry I now know there are so many efficient and effective technical analysis indicator that could help easily analyze and predict the future price of STEEM, also I learned how volume can help traders easily analyze the future trend or movement of STEEM in the market.
Note:All images other images I didn't source were gotten from Tradingview and Bybit exchange application
Thanks for going through remember starrchris cares ❤️, please I am inviting my friends @sahmie @ngoenyi @hamzayousafzai @jaytime5 @jasminemary to paticipate.
The RSI and Moving Average are great indicators when used together. While the first shows when a pair is overbought or oversold. MA on the other hand helps in providing entry and exit points.
These two can be combined to identify great entry and exit points.
However, care must be taken while using RSI on lower timeframes, as if not checked on a higher timeframe, it could signal a wrong entry for the trader.
Thank you for making out time to present this great writeup. I wish you the best in this contest.
Yes ma'am the combination of this two indicators are really powerful and profitable to all traders, thanks for your comment ma
Your post has been successfully curated by @𝐢𝐫𝐚𝐰𝐚𝐧𝐝𝐞𝐝𝐲 at 45%.
Thanks for setting your post to 25% for @null.
We invite you to continue publishing quality content. In this way you could have the option of being selected in the weekly Top of our curation team.
Dear @irawandedy I really appreciate your good job friend, thanks
Thanks do much sir, for inviting me. I have participated and I must say that your explanation is well explain for both novices and expert to understand. MACD is a good momentum based indicator that helps us to know market direction so we can follow up.
Good luck to you sir.
Yes friend you are right I just saw your entry thanks for participating and thanks for also commenting on my entry. I appreciate
Wishing you good luck to dear 🙏
Thank you, friend!


I'm @steem.history, who is steem witness.
Thank you for witnessvoting for me.
please click it!
(Go to https://steemit.com/~witnesses and type fbslo at the bottom of the page)
The weight is reduced because of the lack of Voting Power. If you vote for me as a witness, you can get my little vote.
Thanks boss I really appreciate your good work
It's valuable to explore diverse indicators like the KDJ for trend signals and price movement predictions. Your posts adds depth to understanding these indicators, and I appreciate the informative content.
Thanks I really appreciate your comment dear friend, Its for the betterment of our lovely. Blockchain technology
😊😊
Upvoted! Thank you for supporting witness @jswit.
You have really been trying and I always appreciate
Hey brother, I have to say, you did an awesome job explaining all those trading indicators. Your explanations were so clear and easy to understand. I really liked how you included those graph images to help illustrate your points. It made everything much clearer.
You also did a great job emphasizing the importance of using stop-loss to manage risk. Your strategies based on Bollinger Bands and support/resistance lines were spot on. And let's not forget about position diversification! You really highlighted the need to reduce risk and increase profits. Maybe adding some real-life examples would make it even stronger.
I also appreciated how you emphasized the significance of fundamental factors, especially those related to STEEM and stablecoins. And your explanation of volume and its connection to potential trends was right on the money.
Overall, your article was super informative and easy to follow. Keep up the great work, brother. You're doing fantastic in the trading world.
Thanks boss you have also done amazing to I must commend you for your job.
How the new year go be my guy na
Thank you for the kind words, I appreciate the shoutout. As for the new year, I hope it's gonna be a blast for both of us. Any exciting plans or goals you've got in mind? Let's make it a year to remember.
😊
@starrchris
As we know the news affects STEEM/USDT both internal and external. Just yesterday's news let me tell you that the market has been volatile yesterday and today is the same today as the market is volatile. Ascension is called if the news in the market is positive, then the market moves upwards, but it means that the direction of the green indicator, which I am referring to, turns green, which means that everywhere. Why does the market start to mention highs if you see negatives instead of positives it means the market is going down means red signal means risk and red signal means market is negative. There is a negative trend going towards Other your activity is great and the post is excellent and very well it has some points which we got to learn and I hope this post of yours will be number one post.
In fact the latest bullish trend was as a result of fundamental news from top crypto exchanges like binance and Bybit exchange. Thanks for sharing
Gracias por presentar un lucido contenido lleno de detalles e información valiosa de la cual se puede aprender.
En particular ya había tratado un poco la herramienta de las bandas bollinger, muy versátiles, útiles, fáciles de aplicar y de interpretar, me parece una de las mejores para estudiar la volatilidad y los posibles cambios de tendencias.
El indicador MACD es nuevo para mí y me gustó su aplicación, muy interesante el cruce de la MACD con la EMA (9) o señal y su coincidencia en zonas claves dentro de la Bandas de Bollinger donde podremos precisar los puntos para apertura y cierre de posiciones con un panorama más claro cuando éstos dos indicadores se combinan.
Has abordado cada pauta del desafío con dominio de la materia y será de gran ayuda y aporte al conocimiento y comprensión de los lectores.
Saludos y mucho éxitos. ¡Feliz Año Nuevo!