SPS Price Following Same Pattern Before
SPS Price is following same pattern that happened before. I havent met with a chart like this. Price is moving same as before.
A peak and a dip, consolidation and double dip...
Whole pattern has been completed in 56 days. It is second time for same pattern and we are in 54th day.
I want to see this pattern happen!!
We will see 56th day, 2 day later. That means is after weekly close. This week may be last week for SPS price consolidation and double dip pattern may be completed...
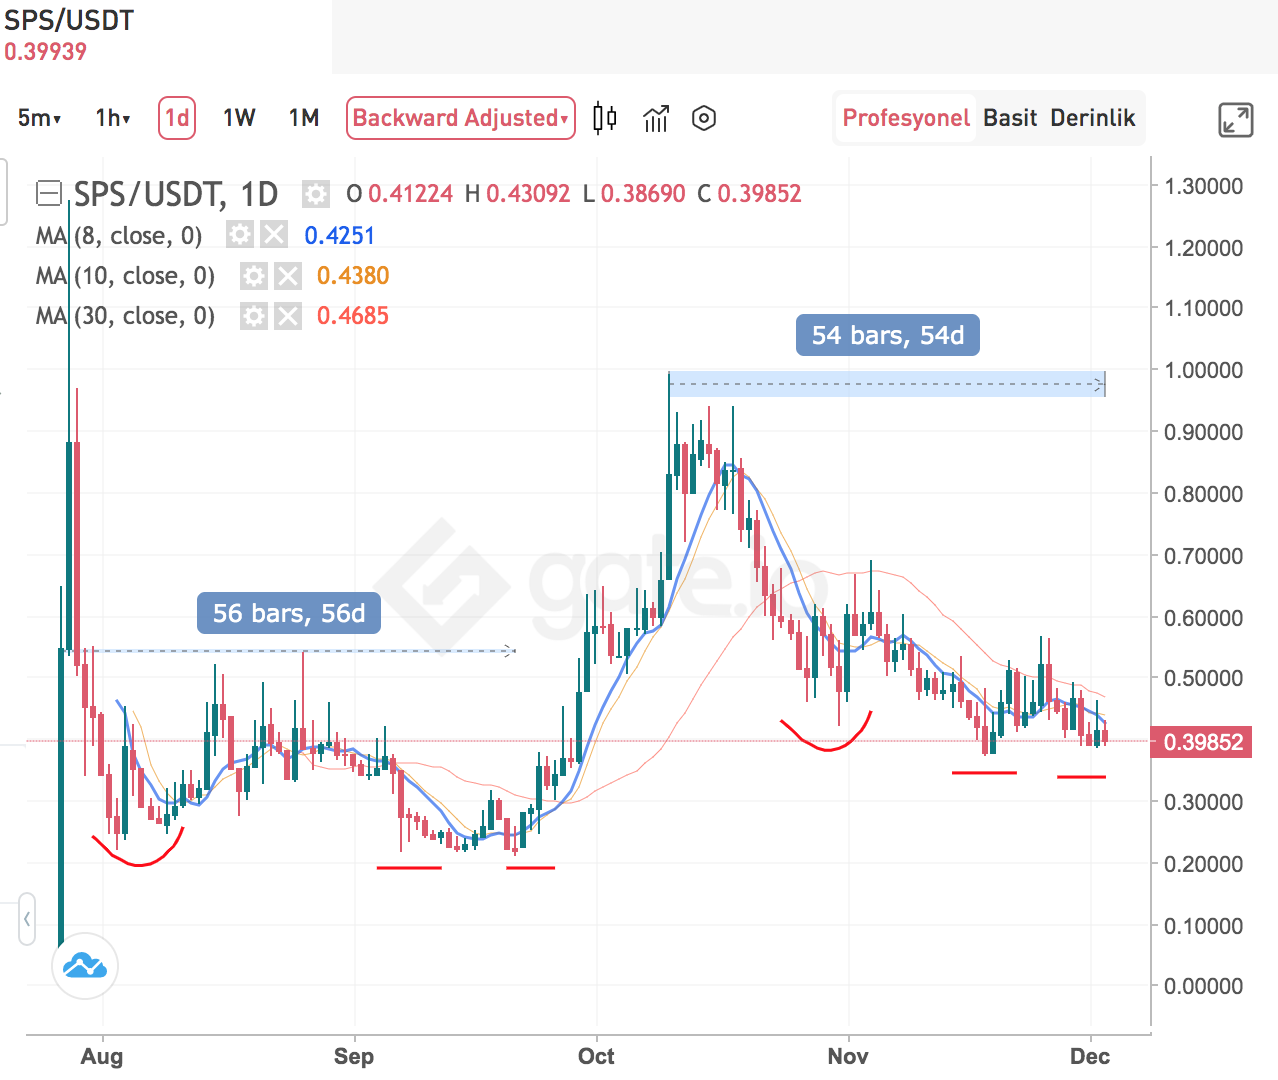
I haven't seen a price chart than before!
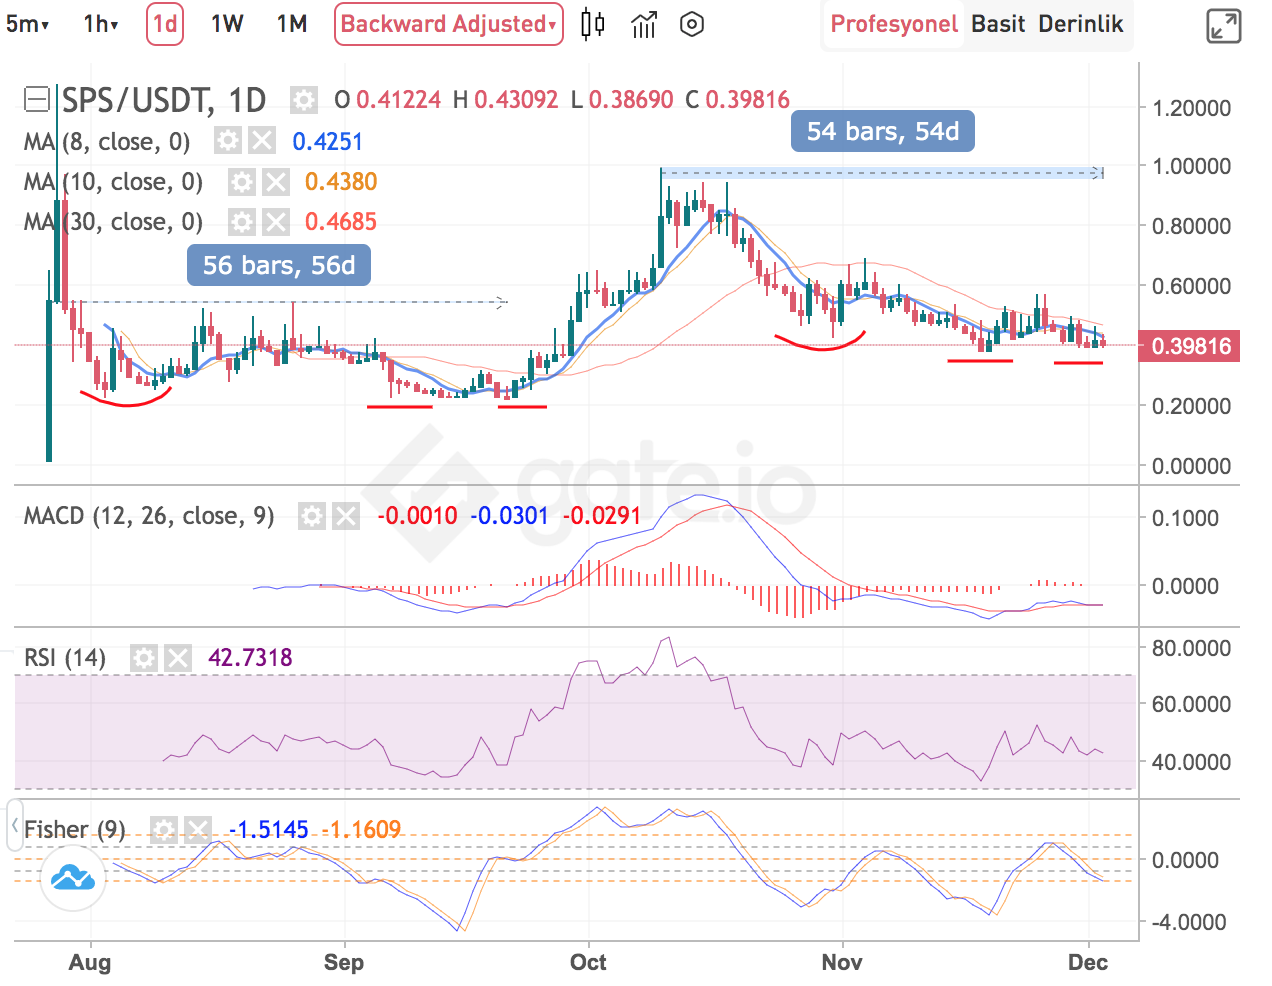
MACD and Fisher indicators show us trend may turn in a few days. If trend turns, My thesis may happen!
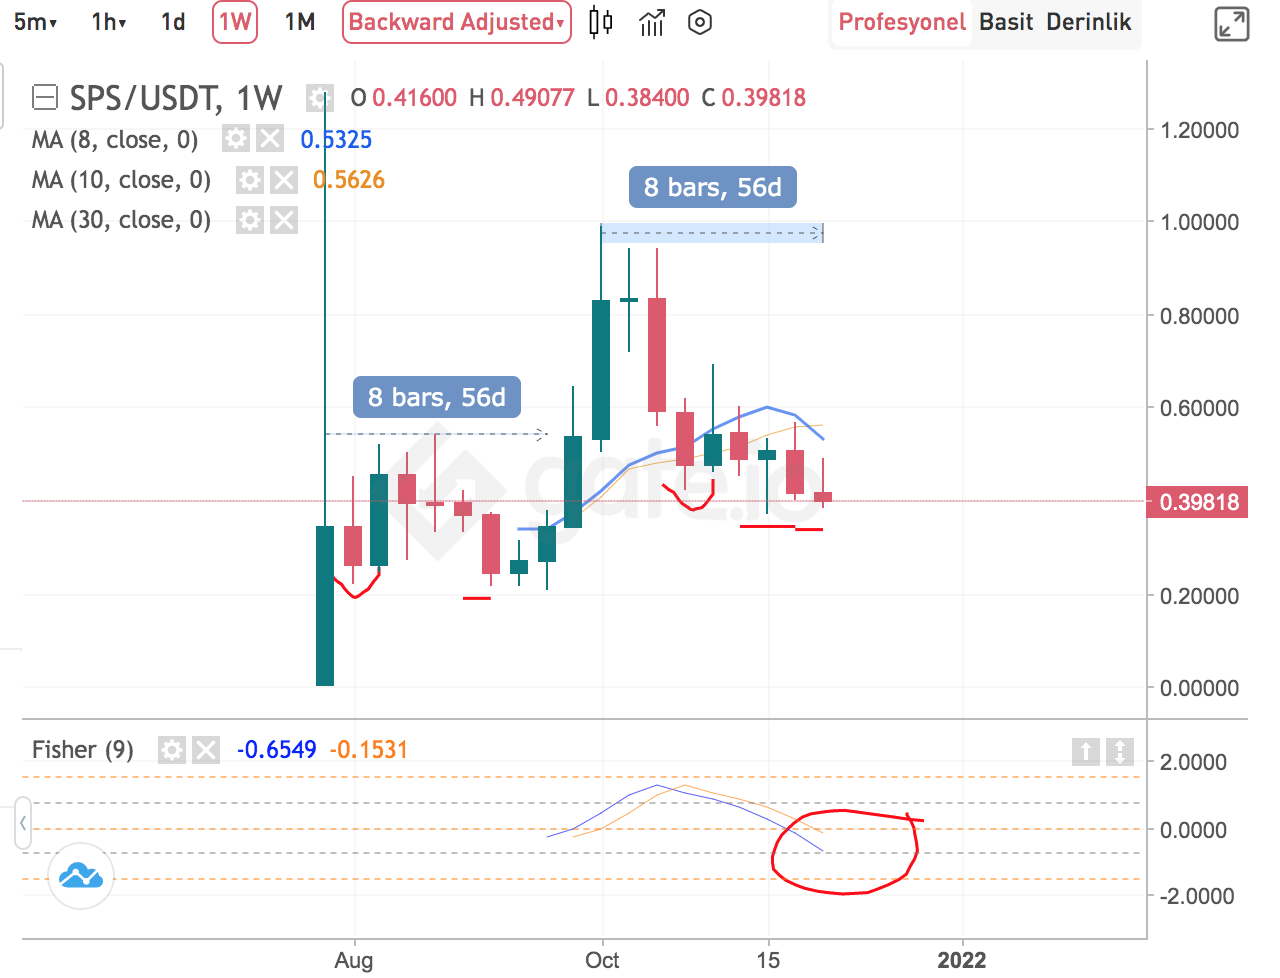
Here is weekly chart of SPS. I use Weekly fisher trend that show midterm trend. After weekly close, SPS price may go up next week and Trend may be turned...
I think it was quite a different technical analysis. But the SPS price chart fascinated me!
We will see what will happen..
That is nice