Topdown Analysis Of AVAXUSDT Using Support And Resistance Strategy And RSI Indicator As Confluence
Hello great minds,
I feel honored to approach you all today to discuss on a very important issue in the cryptospace.
I believe you are all doing perfectly fine and are enjoying your activities in the community as you actively promote steemit across various social media platform.
Today I will be sharing my analysis on the token of avalanche network which is avax, and I will be sharing my analysis on avax against usdt.
Please stay tuned as I share my analysis
ANALYSIS USING SUPPORT AND RESISTANCE STRATEGY
Technical analysis are best started from the higher timeframe and then to the lower timeframe.
Some analyst prefer starting their analysis from the daily timeframe, down to the fewer minutes, but I begin mine from the monthly timeframe.
The monthly timeframe helps me to compress market activities and display them on a screen.
And the monthly timeframe also helps in eliminating unnecessary noise from the market.
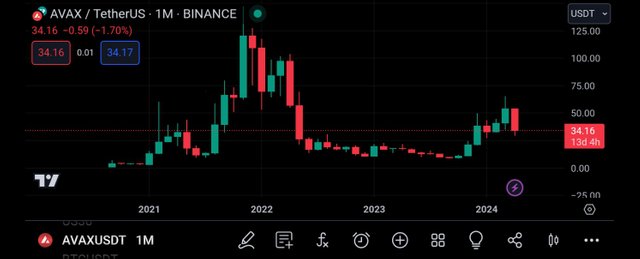
The screenshot above is that of AVAXUSDT on the monthly timeframe, and as seen above, there are less noise on the price chart.
And also, we can see that it is easier for the market trend to be detected on this timeframe, as every candle on this timeframe was formed during the timeframe of 1month.
The overall trend of the pair AVAXUSDT from the above screenshot can be said to be bearish but it's latest leg is being bullish overall.
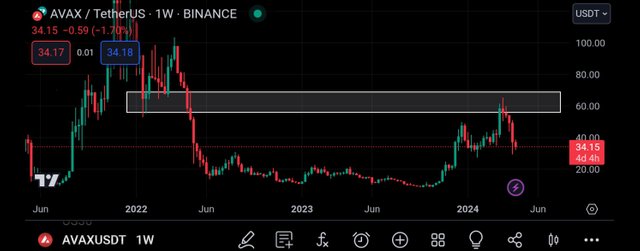
I then proceeded by continuing my analysis on the weekly timeframe.
From this timeframe, I was able to see more market activities, as there are more candlestick on this timeframe.
Looking carefully, I was able to detect a key level on this timeframe, and this level is acting as a resistance level to the market price.
Also, this level is responsible for the recent bearish move of the market, just as seen above.
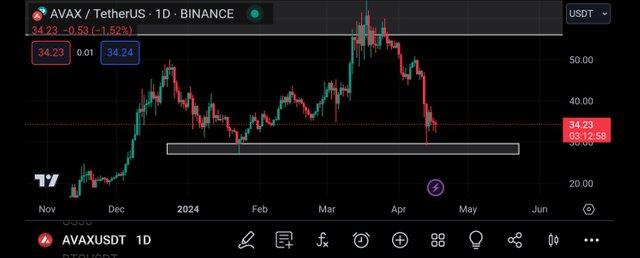
Then I moved to the daily timeframe for more market analysis.
On this timeframe, I saw more market activities than on the weekly timeframe, and I can see the buyers and sellers trying to push price to their preferred direction.
And also on this timeframe, I was able to spot another key level, and this level is functioning as a support level to the market.
And from the above screenshot, we can see that the market touched this level before moving in the upward direction.
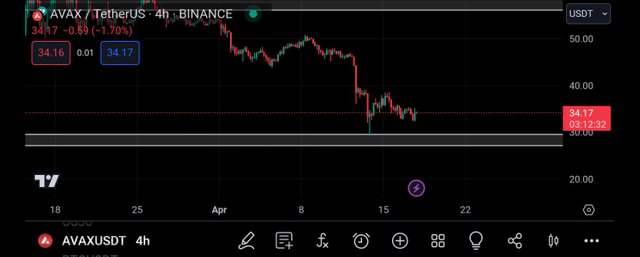
Moving to the 4hr timeframe, I could see more market activities.
I can see the market more clearly, and I can see that the market is going back to retrace backward to this support level.
And it is expected for the market to be rejected again once it gets to this support level, and then I decided to continue my analysis on the 2hr timeframe.
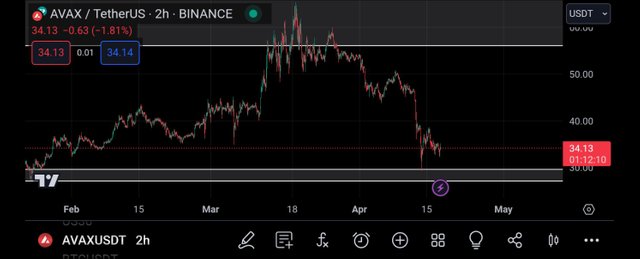
And then I continued my analysis on the 2hr timeframe.
It is on the 2hr timeframe I take my entry into the market, and from this analysis, I expect to see the market experience a bullish move.
Then I decided to use rsi indicator as a confluence before entering the market.
CONFLUENCE USING RELATIVE STRENGTH INDEX INDICATOR
The rsi Indicator is a very important trading tool in the cryptomarket.
The rsi indicator is used to spot oversold and overbought market regions.
And when a market is spotted to be oversold, it is a signal that the market is about to experience a bullish move.
And when a market is spotted to be overbought, it is a signal that the market is about to experience a bearish move.
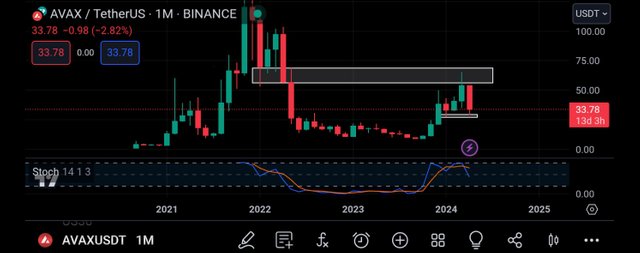
Then I decided to add the rsi indicator to the monthly timeframe.
And on this timeframe, I can see that the rsi has crossed above it's 80% line, and this is an indication that the market is being overbought.
An overbought market region is usually seen as a bearish trend reversal signal, that is the market is about to experience a bearish move.
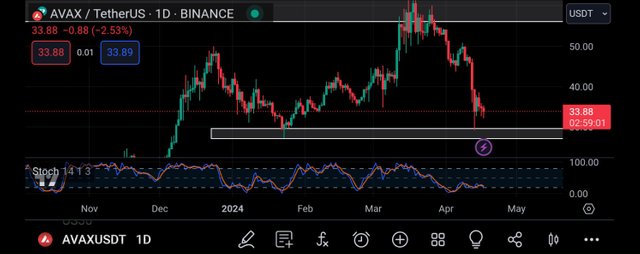
Applying the rsi indicator to the daily timeframe, I saw that the market is being oversold.
An oversold market region is often detected when the market crosses below the 20% line, and this is a bullish trend reversal signal.
A bullish trend reversal signal indicates that the market is about to experience a bullish move.
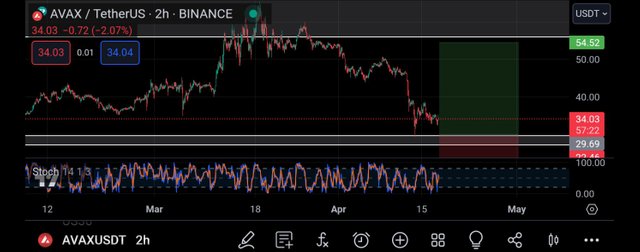
Then I moved to the 2hr timeframe which is the timeframe in which I entered the market.
And I also noticed that the market is being oversold, and this is an indication that the market is about to go bullish.
And as such I joined the market from the closest support level and I placed my take profit on the closest resistance level to the price chart just as seen above.
CONCLUSION
Avalanche is a very nice crypto project in the cryptospace and its native token is what we know to be avax.
And as seen above, I have shared my analysis on AVAXUSDT, and I intend for my post to be taken as an educational content and not a financial advise.
https://twitter.com/JuecoYoung/status/1780716580848214139
Upvoted! Thank you for supporting witness @jswit.