Top Down Analysis Of ETHUSDT Using Support And Resistance Strategy And RSI Indicator As Confluence
Hello great minds,
It is a great opportunity to come before you all today to share my technical analysis on eth against usdt.
I believe you are all doing perfectly well and are enjoying your activities in the community as you actively promote steemit across various social media platform.
Ethereum is a very big cryptocurrency in the cryptospace and we are well aware of this.
Ethereum happens to be the second most biggest and popular cryptocurrency in the cryptospace.
After Bitcoin which is the driver of all other tokens, ethereum is known to be the next most valuable token, and I am here to share my analysis to it.
ANALYSIS USING SUPPORT AND RESISTANCE STRATEGY
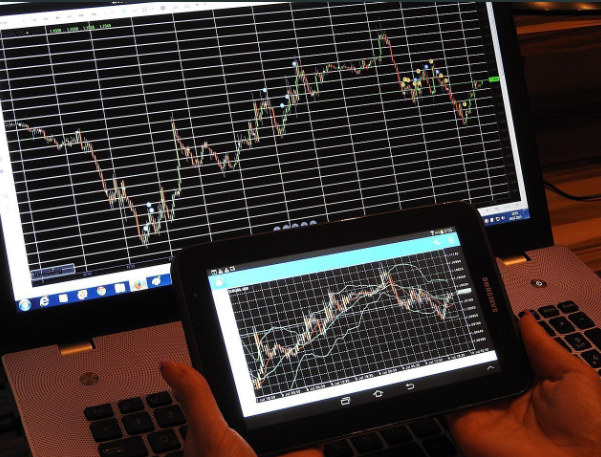
I begin my technical analysis from the higher timeframe, then I descend to the lower timeframe
On the higher timeframe, ideally the monthly timeframe, I seek to determine market trend
The monthly timeframe helps to eliminate market noise from the market and also compress the market to one screen.
And from this, it becomes very easy for the market trend to be predicted.
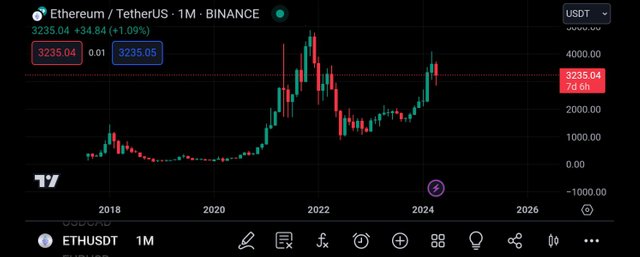
The screenshot above is that of the pair ethusdt on the monthly timeframe.
And as seen above, there are lesser candles on this timeframe and this is as a result of the time it takes for one of this candles to be formed.
On the monthly timeframe, it takes the time period of 1month for each candle to be formed.
And also, it is easy for the overall trend of the market to be detected on this timeframe, as we can see that the market is being bullish.
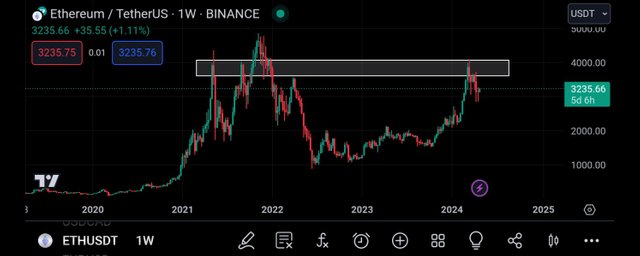
After the identification of the market overall trend, I continued my analysis on the weekly timeframe.
On this timeframe, I can see that there are more market candles than on the monthly timeframe.
Also on this timeframe, I was able to detect a key market level which is functioning as a resistance level to the market price.
And it is expected that whenever price gets to it, price gets rejected, just as seen from the above screenshot.
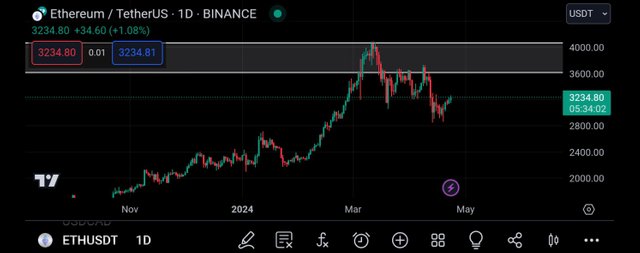
I then continued my analysis on the daily timeframe, and on this timeframe, I can see the presence of noise in the market.
I came to the daily timeframe to be able to see price movement clearly which will aid me in making good trading decisions.
From this timeframe, I can see that the market has been rejected from the resistance level just as expected as it forms series of bearish candles.
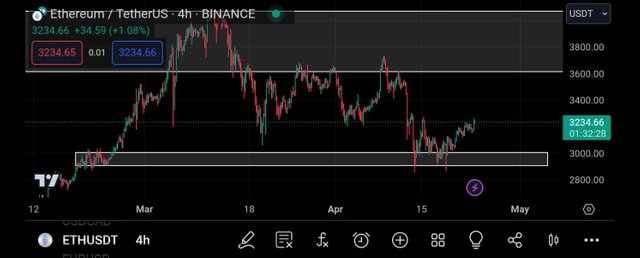
Moving to the 4hr timeframe, I saw market movement more clearly.
Also on this timeframe, I was able to spot a key level, and this level will be functioning as a support level to the market price.
And from the above screenshot, we can see that the market price has gotten to this level and the market has been rejected from this level.
This rejection has given me a bullish bias to the market and as such I will be moving to the 2hr timeframe in search of entry.
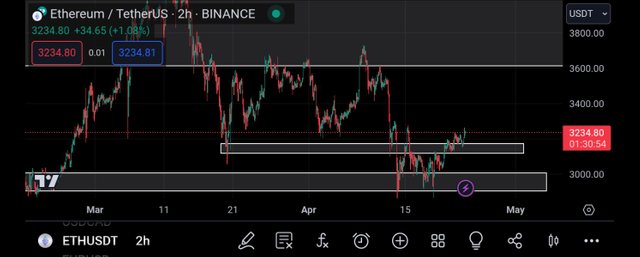
Moving to the 2hr timeframe, I saw lots of noise in the market, as each candle was formed within the space of 2hr.
Then I spotted a minor level which I can easily trade off, and before then, I u decided to make use of the rsi indicator in search of trading confluence.
CONFLUENCE USING RELATIVE STRENGTH INDEX INDICATOR
The relative strength index indicator is an indicator that helps to identify overbought and oversold market.
When a market is spotted to be overbought, it is a bearish trend reversal signal and when it is oversold, it is a bullish trend reversal signal.
An overbought market can be spotted when the rsi crosses above the 80% line and an oversold market is detected when the market crosses below the 20% line.
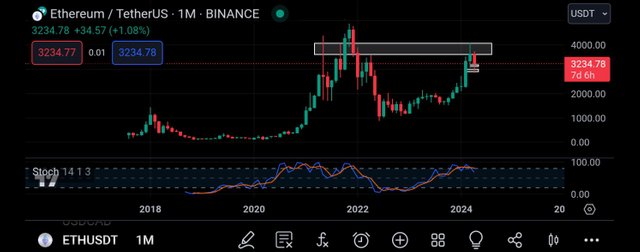
Applying the rsi indicator to the monthly timeframe, I noticed that the rsi has crossed above the 80% line and this is an indication that the market is being overbought.
And an overbought market is one that signals a bearish trend reversal, that is, we expect to see the market experience a bearish move.
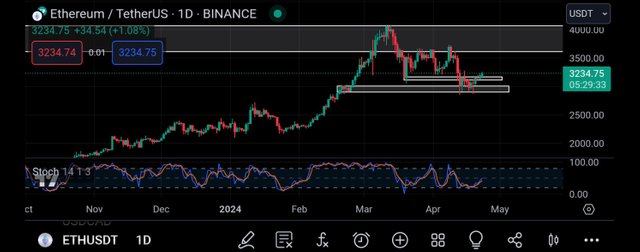
Then I moved to the daily timeframe for more analysis using the rsi indicator, and I noticed that the rsi has crossed below it's 20% line.
And this is an indication that the market is about to experience a bullish move, as it is seen as a bullish trend reversal signal
Then I decided to move to the 2hr timeframe to search for my entry into the market.
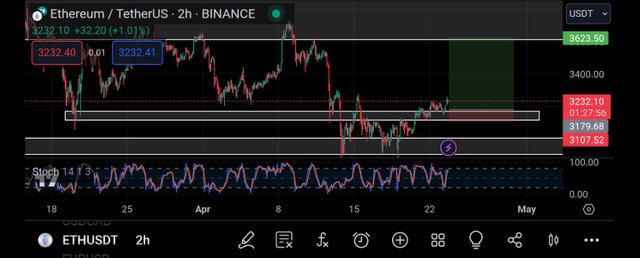
Moving to the 2hr timeframe, I noticed that the market is being oversold but the market is bullish overall.
And as such, I decided to place a buy order on the market from the level I marked out, and my take profit was placed on the closest resistance level to the price chart.
CONCLUSION
I have shared my analysis on ethusdt beginning from the monthly to the weekly to the daily and to the hourly.
From my analysis, I expect to see a bullish move on ethusdt.
Upvoted! Thank you for supporting witness @jswit.
https://twitter.com/JuecoYoung/status/1782876102270038355