Topdown Analysis Of DOGEUSDT Using Support And Resistance Strategy And RSI Indicator As A Confluence
Hello great minds,
It is another great day and I feel honored to come before you all today to share my analysis on Dogeusdt.
I believe you are doing perfectly fine and are enjoying your activities in the community as you actively promote steemit across various social media platform.
Doge coin is not an unpopular cryptocurrency in the cryptospace, it is known to be a meme coin influenced by Elon musk.
I decided to take an analysis on Doge coin today, please tag along.
ANALYSIS USING SUPPORT AND RESISTANCE STRATEGY
My analysis using support and resistance strategy often start from the higher timeframe to the lower timeframe.
On the higher timeframe, my aim is to detect the overall market trend, to check if the market is bearish or bullish overall, as this will play a crucial role in affecting my trading decisions.
And also the monthly timeframe, filters out noise from the chart and this will enable traders to make a more informed trading decision.
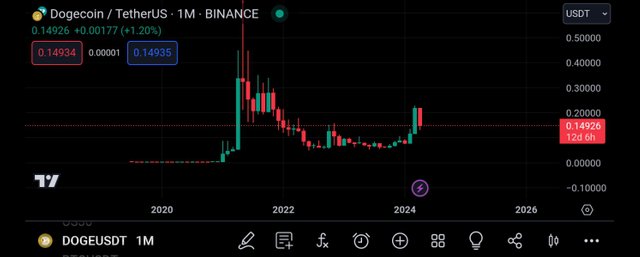
The screenshot above is that of Dogeusdt on the monthly timeframe, and as seen above, there are bullish and bearish candles in the market.
Also, we can see that there are lesser candles on this timeframe and this is because each candle is being formed within the period of 1month.
Also on this timeframe, it is easier for the market overall trend to be detected, and we can see that the market is being bearish overall.
Then I proceeded with my analysis by moving to the weekly timeframe.
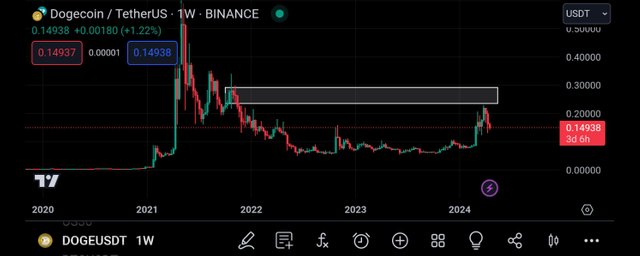
On the weekly timeframe, I noticed that there are more candlestick on the price chart, and this is most likely because each candle is formed within the duration of one week of trading activities.
On this timeframe, I was able to spot a key market level which is functioning as a resistance level to the price chart.
And as seen, the market has gotten to this level and it is expected for the market to be rejected when it gets to this level.
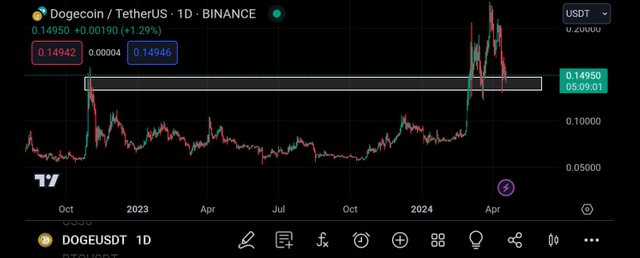
I then continued my analysis on the daily timeframe where I can see more market details.
On this timeframe, there are more market noise than on the weekly timeframe, which is expected.
And also, on this timeframe, I was able to spot a key market level, a level which is functioning as a support level to the price chart.
And from the above screenshot, we can see that the market has gotten to this level, and we expect to see a rejection from this level.
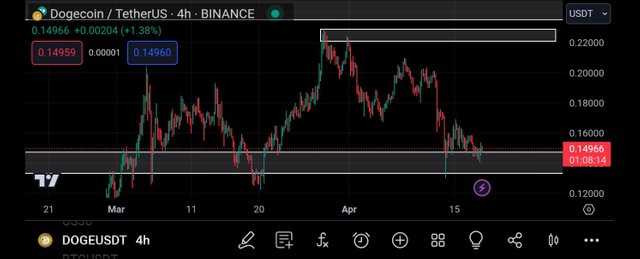
On the 4hr timeframe, I can see bullish rejection on the market, and this gave me my bullish bias of the market.
Also, I was able to detect another key level which I intend to place my take profit on, it is a level I expect the market to get to when it begins it's bullish move.
Then I decided to continue my analysis on the 2hr timeframe, and it is on this timeframe that I intend to search for my entry.
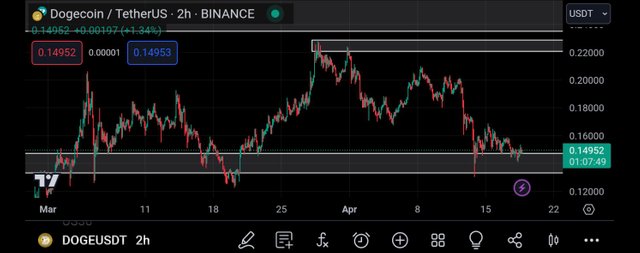
On the 2hr timeframe, I can see the market activities more clearly.
I can see the rejection candles on this timeframe, and with that my bullish bias got strengthened, and I decided to search for confluence using the rsi indicator.
CONFLUENCE USING RELATIVE STRENGTH INDEX INDICATOR
The rsi indicator is a very important technical tool that is used in analysing the cryptomarket.
This Indicator is used to detect overbought and oversold market regions and this inturn influences my trading decisions.
When the market is overbought, it is a bearish trend reversal signal and when the market is oversold, it is a bullish trend reversal signal.
I then decided to apply this Indicator to the monthly timeframe first, before other timeframes.
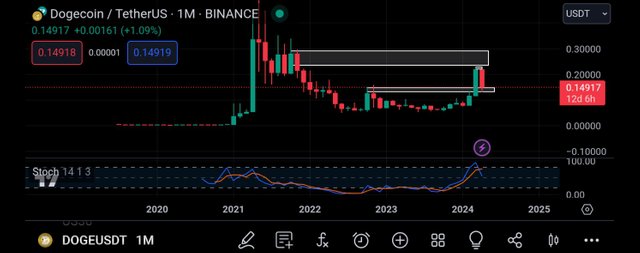
I then decided to add the rsi indicator to the monthly timeframe, and as seen from the above screenshot, the rsi has crossed above it's 80% line.
And this is a signal that the market is being overbought, and an overbought market is seen as a bearish trend reversal signal.
That is, the market is expected to experience a bearish move in the long run.
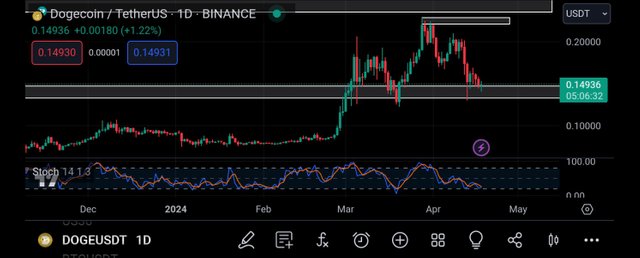
Moving to the daily timeframe, I noticed that the rsi has crossed below it's 20% line, and this is an indication that the market is being oversold.
An oversold market is often a signal of a bullish trend reversal signal, and this implies that we expect to see the market embark on a bullish move.
And this is in alliance with our analysis using support and resistance strategy.
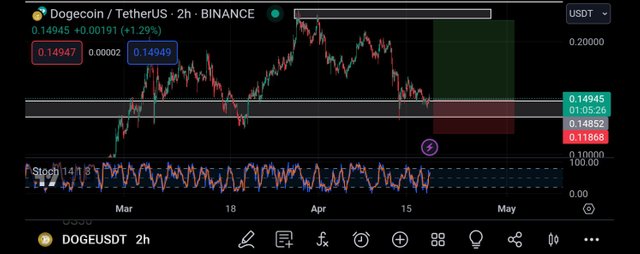
I then moved to the 2hr timeframe in search of entry into the market.
On this timeframe, I proceeded to place my buy order on the closest support level of the price chart and my take profit was placed in the closest resistance level, just as seen above.
CONCLUSION
Doge coin is a token with good fundamental, and this can be confirmed from its historical activities.
I have shared my analysis on Dogeusdt, and I don't want it to be taken as a financial advise.
Thank you all for reading my post.
https://twitter.com/JuecoYoung/status/1781076473023001084
Upvoted! Thank you for supporting witness @jswit.