Topdown Analysis Of BTCUSDT Using Support And Resistance Strategy And RSI Indicator As A Confluence
Hello great minds,
It is a great opportunity to appear before you all today to share my analysis on bitcoin.
I believe you are all doing perfectly fine and are enjoying your activities in the community as you actively share in steemit promotion across various social media platform.
Bitcoin as we know it, is the father of all other cryptocurrency and it is worth carrying an analysis on, since it is the driver of all other cryptocurrency in the cryptospace.
Today, I will sharing my analysis of btcusdt and I will be beginning from the monthly timeframe.
ANALYSIS USING SUPPORT AND RESISTANCE STRATEGY
My analysis often begin from the higher timeframe and it moves to the lower timeframe.
On the higher timeframe like the monthly timeframe, I identify market trends, and on other timeframe I search for key market levels and also search for entries into the market.
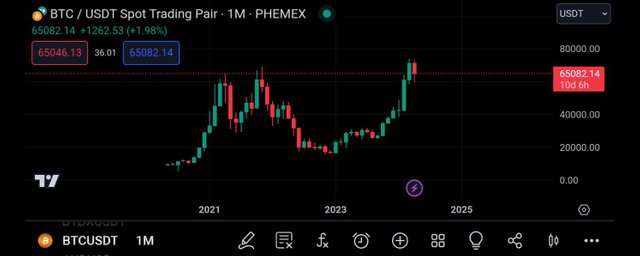
The above screenshot is that of Btcusdt on the monthly timeframe, and as seen above, there are series of bullish and bearish candles on the price chart.
Also, we can see that there are lesser candles on the price chart, and this is because each candle on the price chart takes a period of 1month to be completely formed.
Also, we can see that it is easier for the market trend to be identified on this timeframe, and we can see that the market is in an overall bullish trend.
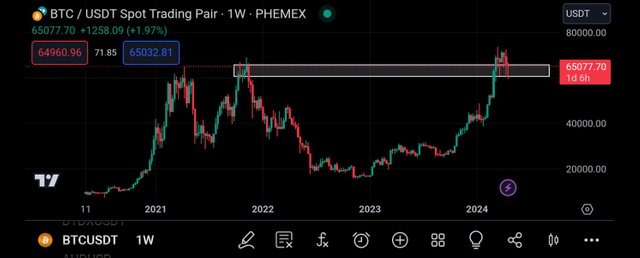
Moving to the weekly timeframe, I could see more market activities on the price chart.
I saw more candlestick and this is because each candle was formed during the space of 1week, and I was also able to spot a key level on this price chart.
This level use to function as a resistance level until it was broken by market price, now it is functioning as a support level to market price.
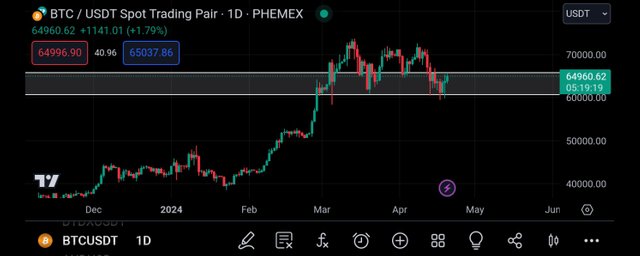
Moving to the daily timeframe, I saw more market noise in form of market candles.
And also on this timeframe, I was able to see the market price more clearly, and I saw that the market has retested the broken level.
Whenever this happens, we expect to see a bullish rejection candle, which will serve as a confirmation for us to enter a buy on the market.
Then I decided to continue my analysis on the 4hr timeframe.
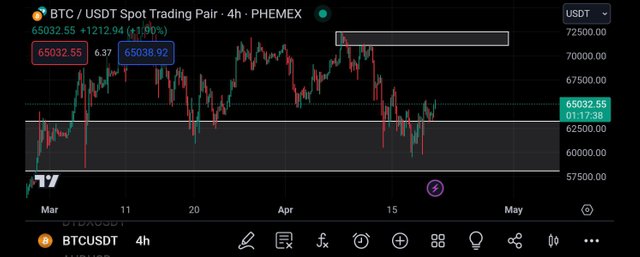
Getting to the 4hr timeframe I could see the market price more clearly.
I can also see noise in the market as the buyers and sellers struggle to drive price to their preferred direction.
Also on this timeframe, I was able to spot another key level which will be my take profit level on the market.
So I expect to see the market get to this level before I expect any significant market reaction.
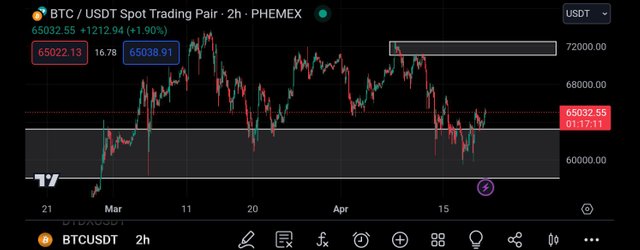
Then I moved to the 2hr timeframe in search of my entry into the market.
On this timeframe, I saw more market activities and my bullish bias for the market was strengthened.
And then, I decided to apply rsi indicator to the market, and this will serve as a confluence to my trade.
CONFLUENCE USING RELATIVE STRENGTH INDEX INDICATOR
The relative strength index indicator is an indicator that helps to identify overbought and oversold market.
When a market is spotted to be overbought, it is a bearish trend reversal signal and when it is oversold, it is a bullish trend reversal signal.
An overbought market can be spotted when the rsi crosses above the 80% line and an oversold market is detected when the market crosses below the 20% line.
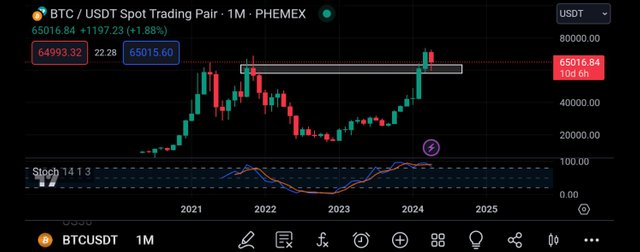
I then decided to begin with the monthly timeframe just as seen in the above screenshot.
From the screenshot above, we can see that the market is being overbought, and this is because the rsi has crossed above its 80% line.
When this happens, the market is said to signal a bearish trend reversal, that is the market is expected to experience a bearish move.
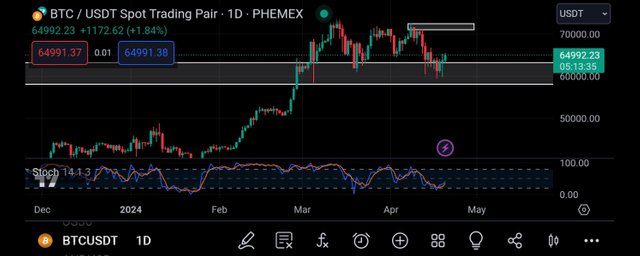
Then I added the rsi to the daily timeframe just as seen above.
And from the screenshot, we can see that the market is being oversold, and this is so because the rsi has crossed below the 20% line.
And this is a signal that the market is about to experience a bullish move, as this is seen as a bullish trend reversal signal.
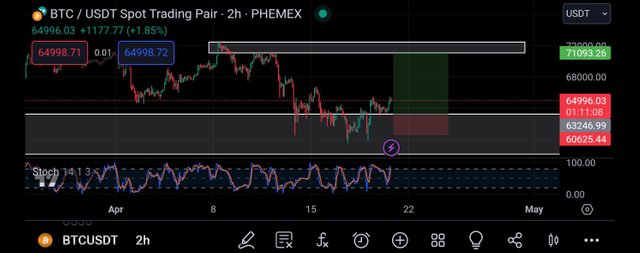
Then I moved to the 2hr timeframe inorder to search for entry into the market.
On this timeframe, I decided to place my buy order on the closest support level to the market price.
And I placed my take profit on the closest resistance level just as seen above.
CONCLUSION
Bitcoin is the father of all cryptocurrency and it is the driver of all other altcoins in the cryptomarket.
I have shared my analysis on the market and I expect to see a momentary bearish move.
https://twitter.com/JuecoYoung/status/1781789800472707288
Upvoted! Thank you for supporting witness @jswit.
Hello friend
You did so well by sharing your analysis on bitcoin with us all. Bitcoin is the pioneer cryptocurrency, it serves as a key driver in the cryptospace. Using the support and resistance strategy, you analyzed btcusdt on multiple timeframes, identifying trends and key levels for potential market entries.