Topdown Analysis Of DYDXUSDT Using Support And Resistance Strategy And RSI Indicator As A Confluence
Hello great minds,
I feel excited to come before you all this evening to relate with you on another interesting post in the community.
I trust you are all doing perfectly fine and are enjoying your activities in the community as you actively promote steemit across various social media platform.
Today I will be sharing my analysis on dydxusdt just as I used to in the community, please stay tuned.
ANALYSIS USING SUPPORT AND RESISTANCE STRATEGY
Dydx is a good token in the cryptospace which is one reason I have chosen it for my analysis today.
And I will be sharing the latest price movement as at when this post was made.
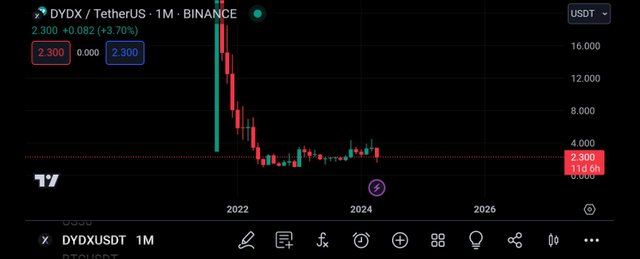
I often begin my analysis from the monthly timeframe and as seen above, is the monthly timeframe of DYDXUSDT.
From the screenshot above, we can see that the market is contained with low or no market noise, and this is because each candle on this timeframe is formed within the space of 1month.
And also from the above screenshot, we can easily determine the overall trend of the market, and as seen, the market is making series of lower lows and lower highs, and this is the components of a bearish market.
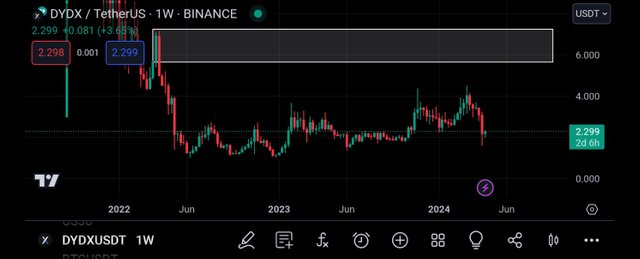
I then continued my analysis by moving to the weekly timeframe.
And on this timeframe, I saw more activities in the market than the monthly timeframe.
Also, I was able to spot a key level on this timeframe, a level which is functioning as a resistance level to the market price.
And it is expected for the market to get rejected when it gets to this level.
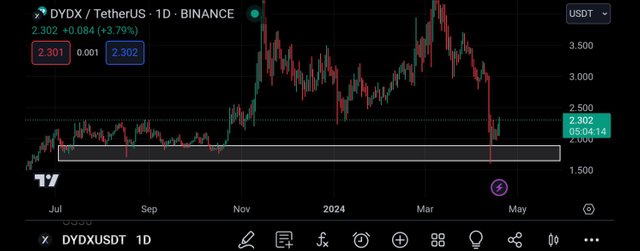
Then I continued my analysis by moving to the daily timeframe.
On this timeframe, i can see so much noise In the market as the buyers and sellers struggle to push price to their preferred direction.
Also on this timeframe, I was able to detect another key level, and this level is acting as a support level to the market price.
From the above screenshot, I can see that the market has gotten to this support level and has been rejected, and it is from this rejection that I intend to join the market.
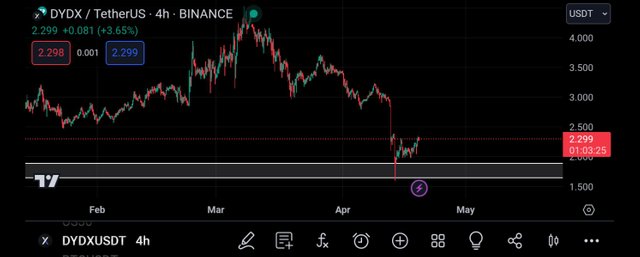
Then I move to the 4hr timeframe for more market activities, and on this timeframe I saw the market more clearly.
I can see the rejection candles on this timeframe as it contains of bullish candles.
It is thus from this rejection that I intend to enter the market and with this bias, I decided to move to the 2hr timeframe in search of entry.
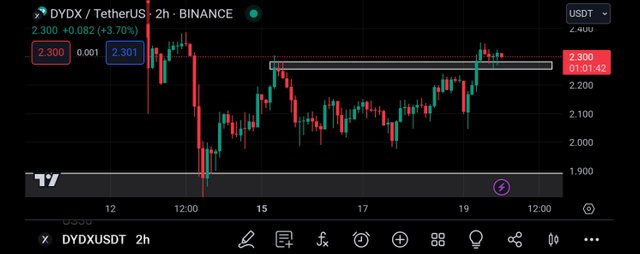
On getting to the 2hr timeframe, I was able to spot another key level, which is a resistance turn support level.
On this timeframe, I can see that the market has broken the resistance level and now it is functioning as a support level to the market.
I then decided to enter a buy on the market but to search for confluence using my rsi indicator.
CONFLUENCE USING RELATIVE STRENGTH INDEX INDICATOR
The rsi Indicator is a very important trading tool in the cryptomarket.
The rsi indicator is used to spot oversold and overbought market regions.
And when a market is spotted to be oversold, it is a signal that the market is about to experience a bullish move.
And when a market is spotted to be overbought, it is a signal that the market is about to experience a bearish move.
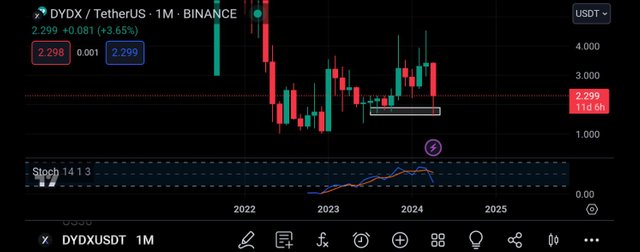
I began by applying the rsi indicator to the monthly timeframe.
And from this timeframe, we can see that the market is being oversold, and this is so because the market has crossed below it's 20% line.
When this happens, it is said that we are to expect a bullish trend reversal, and then I continued my analysis on other timeframes.
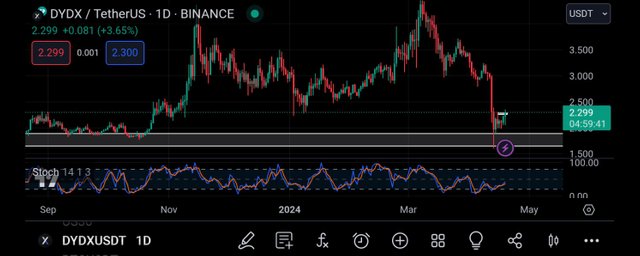
Moving to the daily timeframe, I also noticed that the rsi has crossed below it's 20% line, and this is an indication that the market is being oversold
An oversold market is expected to be bought for the balance to be maintained, and as such we expect to see the power of the bulls in the market.
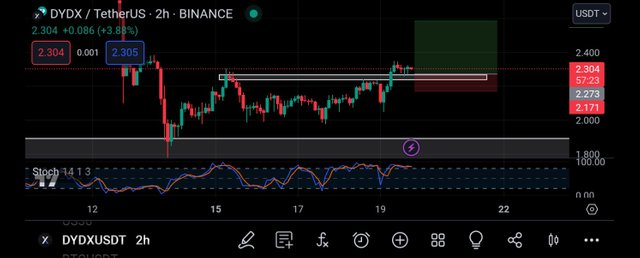
Moving to the 2hr timeframe, I then decided to enter the market.
I entered the market from the closest support level and I placed my take profit on the closest resistance level just as seen above.
CONCLUSION
Dydx is actually a very good token but before investing in it, I'll advise that you make your personal research about it.
My post was made for educational purpose and not as a financial advice.
Upvoted! Thank you for supporting witness @jswit.
https://twitter.com/JuecoYoung/status/1781434326850114006