Technical Analysis (TA)
Assalamu Alaikum
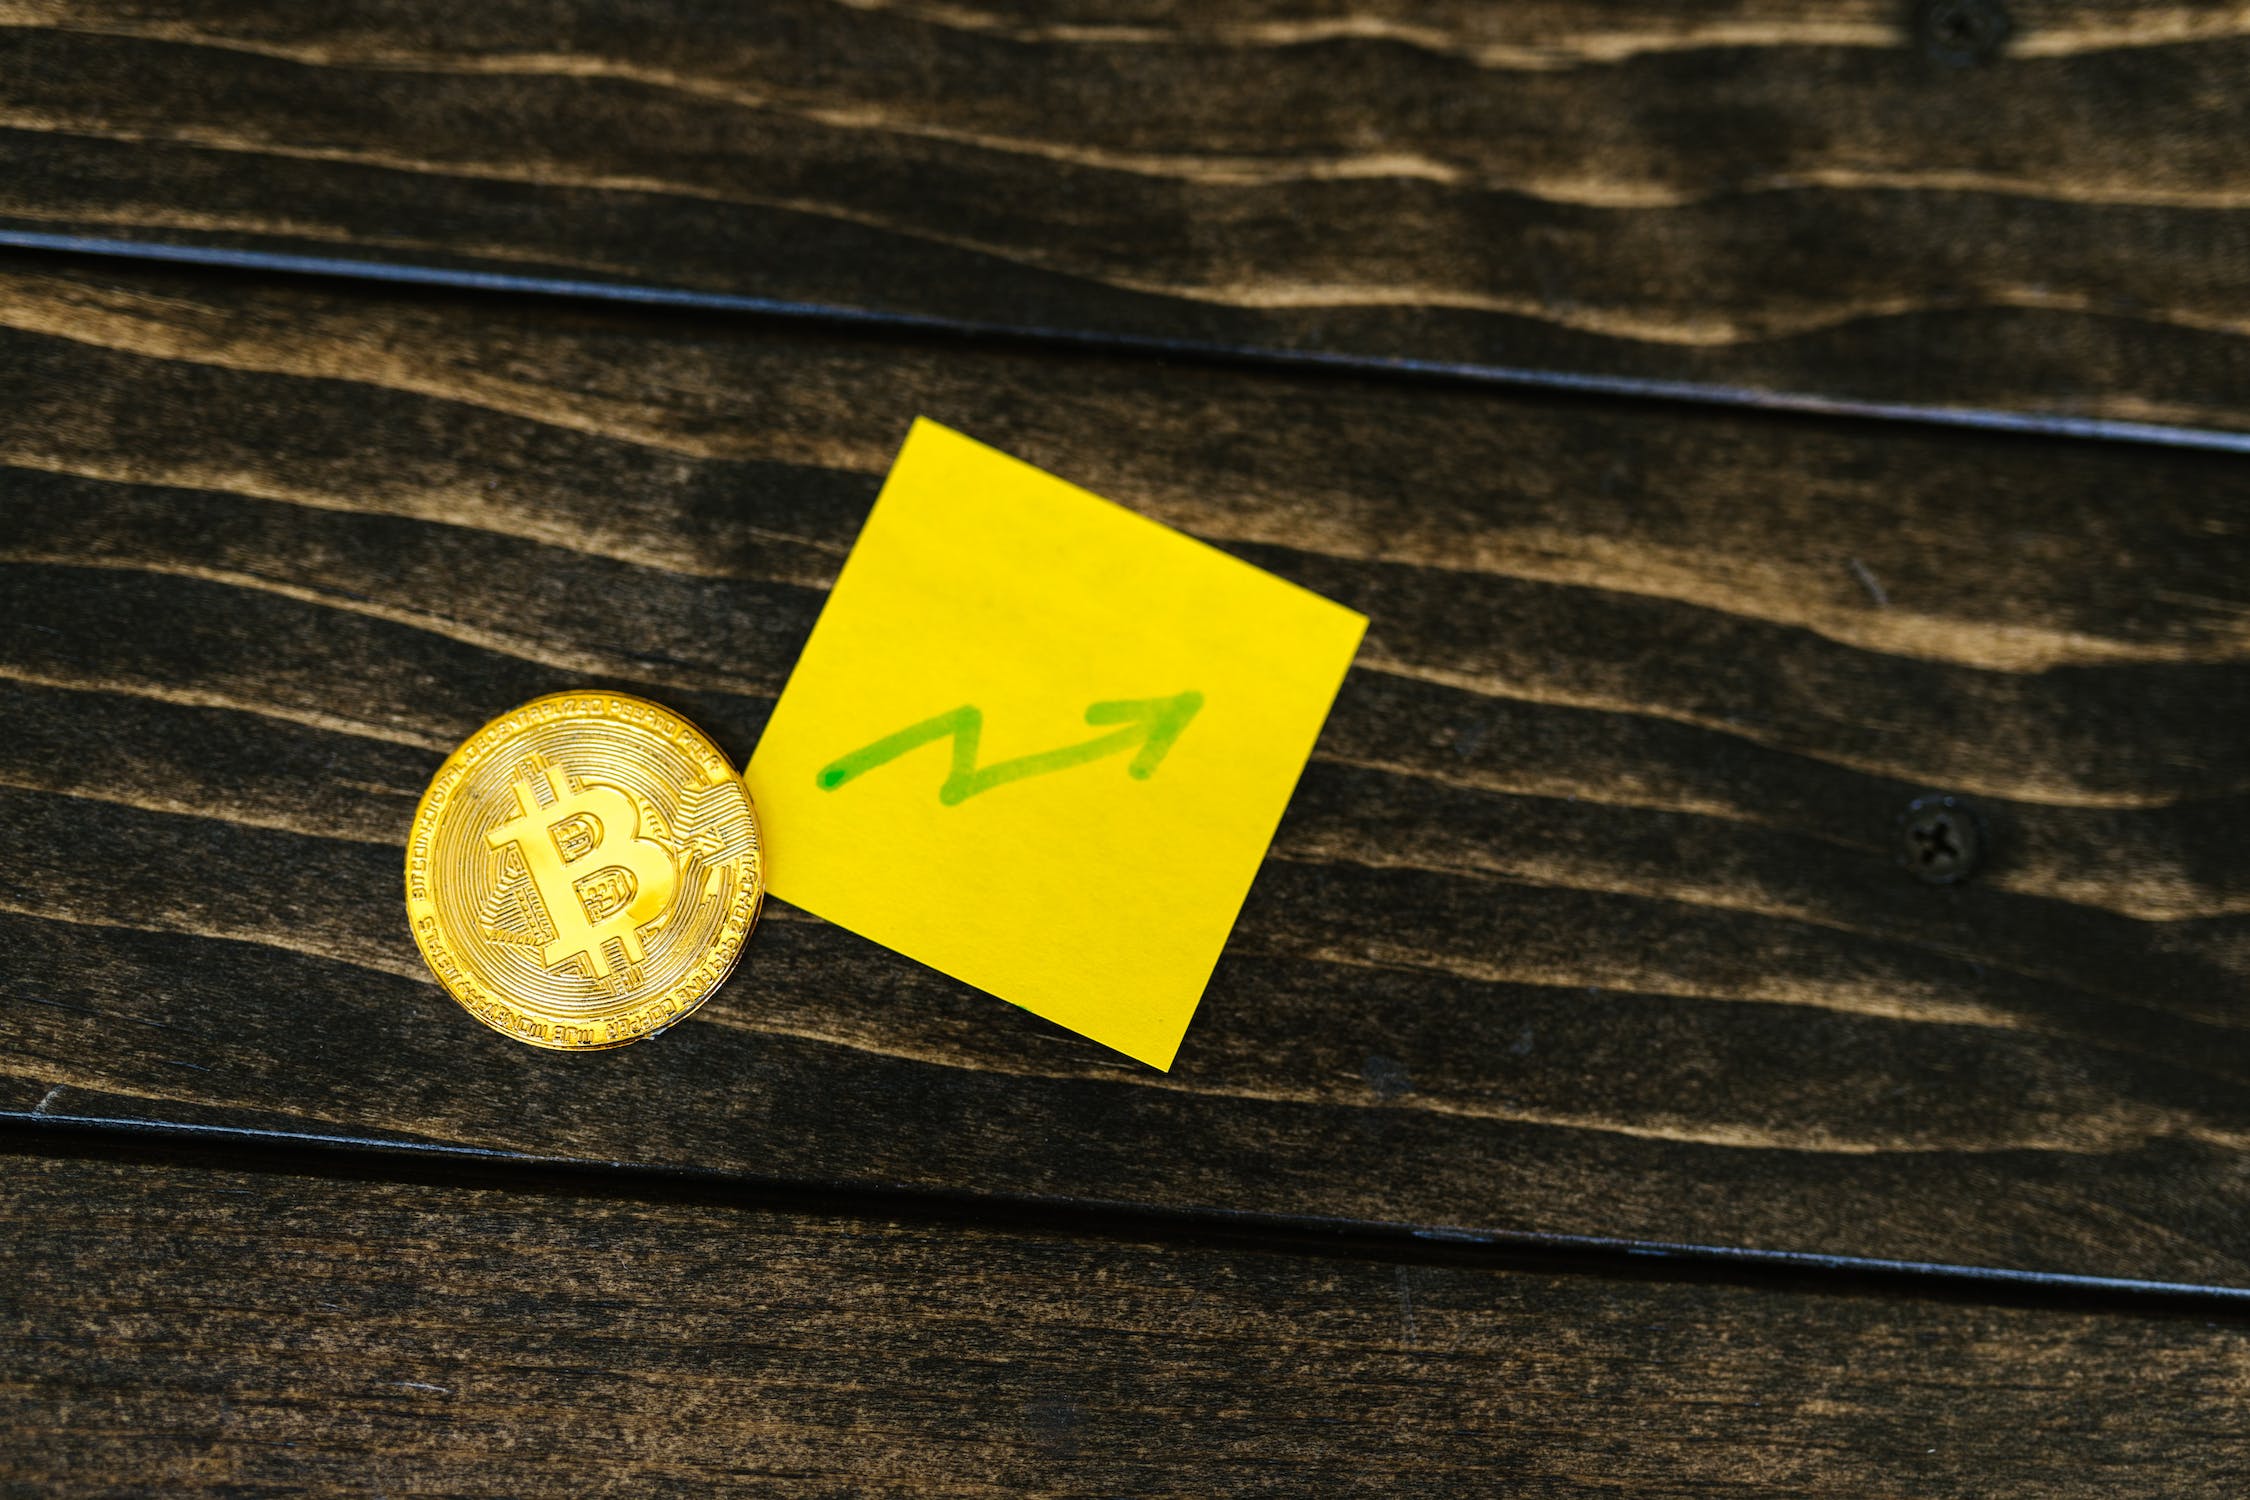
Predicting future market movements or price movements is very important for successful trading in cryptocurrency or any financial market. And the most popular and effective method used by traders around the world to predict this price is called Technical Analysis or TA for short. It is basically an analysis method where the future market situation is predicted based on the past price history, chart patterns and trading volume of the coin, without looking at the underlying price of a cryptocurrency or company news. The main philosophy of technical analysis is based on a famous concept, which is that history repeats itself over and over again. The main tool of technical analysis is the live price chart, where the Japanese candlestick chart, which looks like a candle, is most commonly used. Through these charts, a trader can easily understand the mentality and power struggle of buyers and sellers in the market. Certain geometric shapes or patterns are formed in the chart, such as head and shoulders, double top, double bottom or triangle pattern. By looking at these chart patterns, experienced traders can understand whether the current trend or movement of the market will move forward, or whether a major decline or change in price is about to occur soon. Another very important and primary basis of TA is identifying support and resistance levels. The level at which the pressure of sellers usually decreases and the price starts to rise again due to the increase in the number of buyers is called a support or floor level. On the other hand, the level at which the pressure of sellers to sell the coin increases after reaching a certain level as the price increases and the price cannot rise any further and falls down due to obstacles is called a resistance or ceiling level. If a trader can identify these two levels correctly, he can easily understand at what price the coin should be bought and at what price it is safe to sell and take profit. In addition to looking at charts and patterns, various mathematical indicators are used to make technical analysis more precise and scientific. Some of the most widely used indicators are the Relative Strength Index (RSI), which determines whether a coin is overbought or oversold in the market. Also, indicators like the Moving Average (MA or EMA) and the MACD help measure the direction and speed of the overall trend of the market. By combining all these indicators and chart data, traders plan their entry and exit strategies. In short, technical analysis is a perfect map or compass to navigate the labyrinth of the crypto market. Although it can never guarantee future prices 100%, as the market can turn in a different direction at any time due to sudden bad news or central bank decisions, technical analysis, combined with proper risk management and the use of stop-losses, can greatly increase a trader's chances of making regular profits in the market by reducing the tendency for emotional mistakes. Today's discussion concludes here. I hope you've found it interesting. Please share your thoughts on today's topic. Prayers for everyone. May everyone be well. Amen.
Twitter
High-Yield Curation by @steem-seven
Your content has been supported!
Maximize your passive income!
Delegate your SP to us and earn high rewards
Click here to see our Tiered Reward System
We are the hope!
https://x.com/i/status/2063808955579793651
https://x.com/i/status/2063623153054867831
https://x.com/i/status/2063809278860050451