Understanding Price Action: Break of Structure and Buyers Trap Explained
🪙 Market Overview
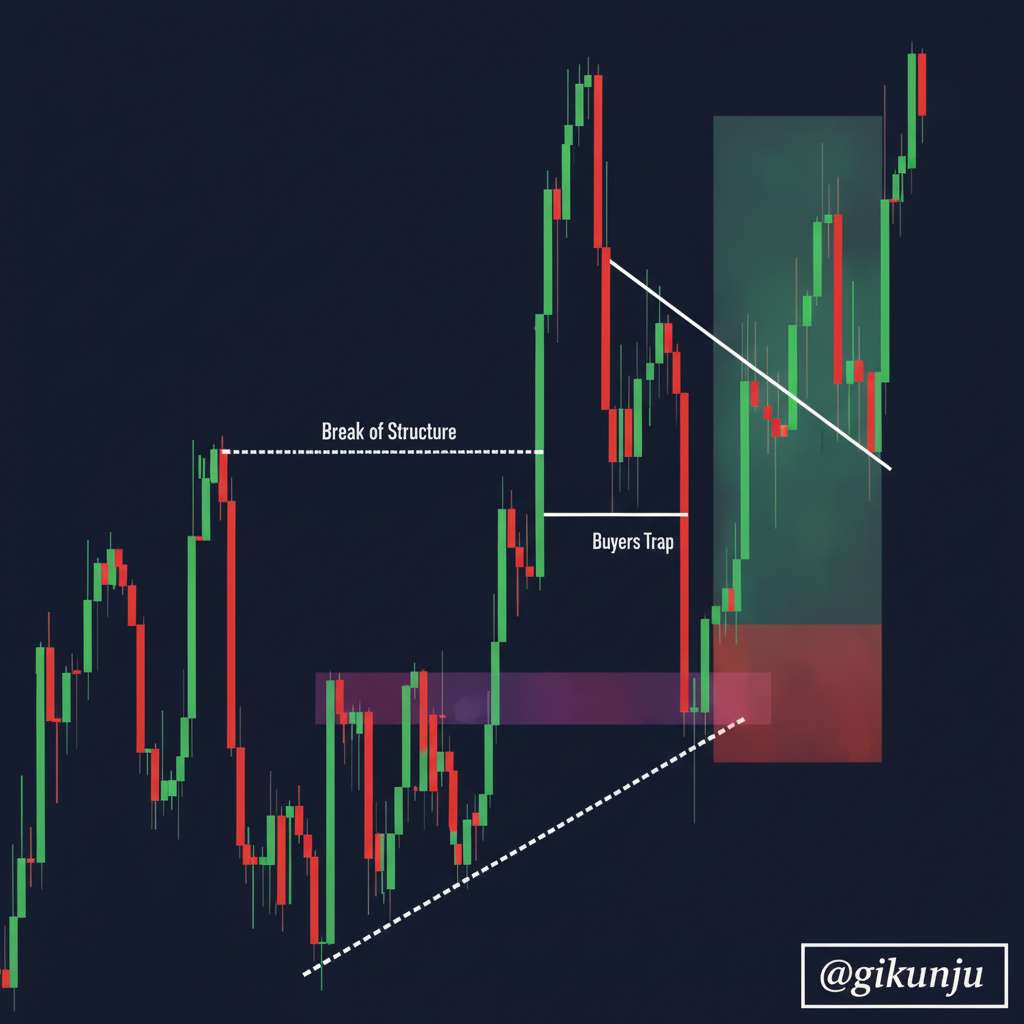
This educational chart illustrates a fundamental price action concept involving a Break of Structure followed by a Buyers Trap. The price initially breaks above a key resistance level, signaling a potential bullish continuation. However, shortly after, the price reverses sharply, trapping buyers who entered on the breakout, only to see the market move against them.
The chart highlights how the market can mislead traders with false breakouts before resuming the main trend.
📉 Price Action Breakdown
Break of Structure:
The price breaks above a previous resistance level (marked by the dotted horizontal line), indicating a shift in market structure from bearish or neutral to bullish.Buyers Trap:
After the breakout, the price pulls back sharply below the breakout level, trapping buyers who expected the price to continue rising. This sudden reversal often triggers stop losses and forces some traders out of their positions.Support Zone and Trendline:
The price finds support at a rising trendline and a highlighted demand zone (shaded in red), which acts as a strong base for the next bullish move.Bullish Reversal:
Following the trap, the price rallies strongly, breaking a descending trendline (black diagonal line) and continuing the upward momentum.
🔍 What This Means for Traders
False Breakouts Are Common:
Traders should be cautious about entering immediately on breakouts without confirmation, as traps can lead to losses.Look for Confirmation:
Waiting for price to hold above the breakout level or for a retest of support zones can improve trade accuracy.Use Support Zones and Trendlines:
These technical levels provide clues about where price might reverse or continue, offering better entry points.Patience and Discipline:
Understanding traps and structure breaks helps traders avoid premature entries and manage risk effectively.