Dubai Real Estate Rental Transactions Report 13 March 2026
Dubai Real Estate Rental Transactions — 13 March 2026
A total of 3,124 rental transactions were registered in Dubai on Friday, 13 March 2026, with a combined value of AED 31,622,987,884.
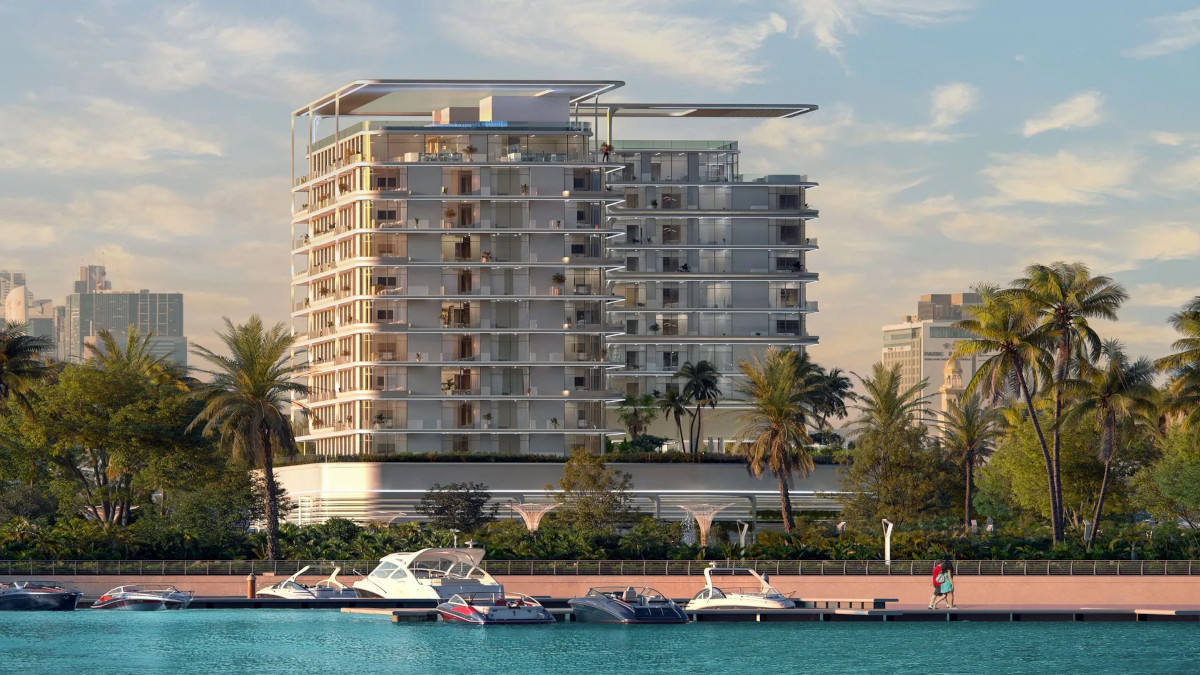
Arka Enclave Dubai Islands Maldivian-Inspired Luxury Residences
Source: Building Arabia.
Rental Transactions by Contract Type
| Category | Number of Transactions | Value (AED) | Value (USD) |
|---|---|---|---|
| New | 1153 | 30,564,400,212 | 8,322,505,163 |
| Renewed | 1971 | 1,058,587,673 | 288,247,154 |
| Grand Total | 3124 | 31,622,987,884 | 8,610,752,317 |
Property Ownership Type
| Category | Number of Transactions | Value (AED) | Value (USD) |
|---|---|---|---|
| Free Hold | 1773 | 31,348,361,279 | 8,535,973,119 |
| Non Free Hold | 1351 | 274,626,605 | 74,779,198 |
| Grand Total | 3124 | 31,622,987,884 | 8,610,752,317 |
Property Type
| Category | Number of Transactions | Value (AED) | Value (USD) |
|---|---|---|---|
| Free Hold | 1773 | 31,348,361,279 | 8,535,973,119 |
| Non Free Hold | 1351 | 274,626,605 | 74,779,198 |
| Grand Total | 3124 | 31,622,987,884 | 8,610,752,317 |
Property Usage
| Category | Number of Transactions | Value (AED) | Value (USD) |
|---|---|---|---|
| Commercial | 889 | 30,622,960,904 | 8,337,089,422 |
| Industrial | 6 | 2,122,087 | 577,832 |
| Residential | 2219 | 996,978,711 | 271,471,400 |
| Other | 10 | 926,183 | 252,201 |
| Grand Total | 3124 | 31,622,987,884 | 8,610,752,317 |
Property Type Breakdown
| Category | Number of Transactions | Value (AED) | Value (USD) |
|---|---|---|---|
| A) Building | |||
| Labor Camps | 1 | 3,636,600 | 990,225 |
| Subtotal A) Building | 1 | 3,636,600 | 990,225 |
| B) Land | |||
| Other | 10 | 926,183 | 252,201 |
| Subtotal B) Land | 10 | 926,183 | 252,201 |
| C) Unit | |||
| Flat | 1577 | 169,291,606 | 46,097,102 |
| Hotel | 259 | 30,464,313,500 | 8,295,252,144 |
| Kiosk | 1 | 108,000 | 29,408 |
| Labor Camps | 458 | 674,223,421 | 183,587,045 |
| Ladies Saloon | 2 | 113,000 | 30,769 |
| Medical center | 1 | 1,311,040 | 357,002 |
| Office | 219 | 54,565,495 | 14,857,861 |
| Restaurant | 15 | 10,148,085 | 2,763,263 |
| Shop | 204 | 72,207,994 | 19,661,809 |
| Showroom | 12 | 4,987,736 | 1,358,131 |
| Staff Accommodation | 36 | 121,305,600 | 33,030,796 |
| Store | 1 | 65,000 | 17,700 |
| Studio | 18 | 600,933 | 163,631 |
| Warehouse | 29 | 5,997,566 | 1,633,102 |
| Warehouse complex | 2 | 211,808 | 57,674 |
| Workshop | 12 | 2,233,083 | 608,055 |
| Subtotal C) Unit | 2846 | 31,581,683,866 | 8,599,505,477 |
| D) Villa | |||
| Complex Villas | 4 | 631,500 | 171,954 |
| Medical center | 1 | 4,420,000 | 1,203,539 |
| Office | 1 | 288,750 | 78,625 |
| Villa | 127 | 27,413,050 | 7,464,411 |
| Subtotal D) Villa | 133 | 32,753,300 | 8,918,529 |
| E) Virtual Unit | |||
| Office | 134 | 3,987,935 | 1,085,891 |
| Subtotal E) Virtual Unit | 134 | 3,987,935 | 1,085,891 |
| Grand Total | 3124 | 31,622,987,884 | 8,610,752,317 |
Top 10 Localities by Rental Value
| Locality | Number of Transactions | Value (AED) | Value (USD) |
|---|---|---|---|
| Palm Jumeirah | 266 | 30,466,721,296 | 8,295,907,773 |
| Jabal Ali Industrial First | 210 | 658,364,738 | 179,268,819 |
| Al Goze Industrial Second | 159 | 116,980,691 | 31,853,149 |
| Muhaisanah Second | 81 | 36,337,990 | 9,894,619 |
| Saih Shuaib 2 | 91 | 32,774,272 | 8,925,602 |
| Al Safouh Second | 8 | 23,087,563 | 6,286,607 |
| Al Barsha First | 48 | 18,491,868 | 5,035,226 |
| Jumeirah First | 24 | 12,887,438 | 3,509,173 |
| Al Thanyah Fifth | 46 | 12,497,897 | 3,403,103 |
| Al Yelayiss 1 | 7 | 12,282,602 | 3,344,480 |
Beyond the ten areas listed above, 124 additional localities recorded rental activity during the day. These areas collectively accounted for AED 232,561,529 in registered value. Examples from the next highest group include Marsa Dubai, Business Bay, and Burj Khalifa.
Registry Notes
Rental registrations on 13 March 2026 were dominated by new contracts, which accounted for the majority of the recorded value. Renewed contracts were more frequent in number but represented a smaller share of total transaction value.
The activity was primarily concentrated in commercial usage, which accounted for the largest share of total rental value. Residential contracts represented the majority of transaction volume, while industrial and other categories accounted for a limited number of registrations.
Rental activity was recorded across 134 localities throughout Dubai, with the highest concentration of value registered in Palm Jumeirah. The overall registry total for the day reached AED 31,622,987,884 across 3,124 transactions.
Disclaimer
This report is based on publicly available market transaction summaries and compiled data related to Dubai real estate activity for the stated period.
Figures are presented for informational purposes only and may vary from final official statistics published by the Dubai Land Department (DLD).
1 US Dollar = 3.6725 UAE Dirhams
This material does not constitute financial or investment advice. Real estate investments involve risk and readers should conduct independent research before making any investment decisions.