Dubai Real Estate Rentals Market Report 12 February 2026
Dubai Real Estate Rentals Transactions Report
12 February 2026
Market Review
A total of 4,221 real estate rental transactions were registered in Dubai on 12 February 2026, with a combined annual rental value of AED 992,131,096. The registered contracts include New and Renewed leases, covering Free Hold and Non Free Hold properties, and span residential, commercial, and other property usages, as recorded in the official dataset for the reporting date.
Lease transactions were recorded across multiple property types, including Building, Land, Unit, Villa, and Virtual Unit, with activity distributed across a wide range of localities. The tables below present the official breakdown of transactions by contract type, ownership type, property usage, property type, and locality.
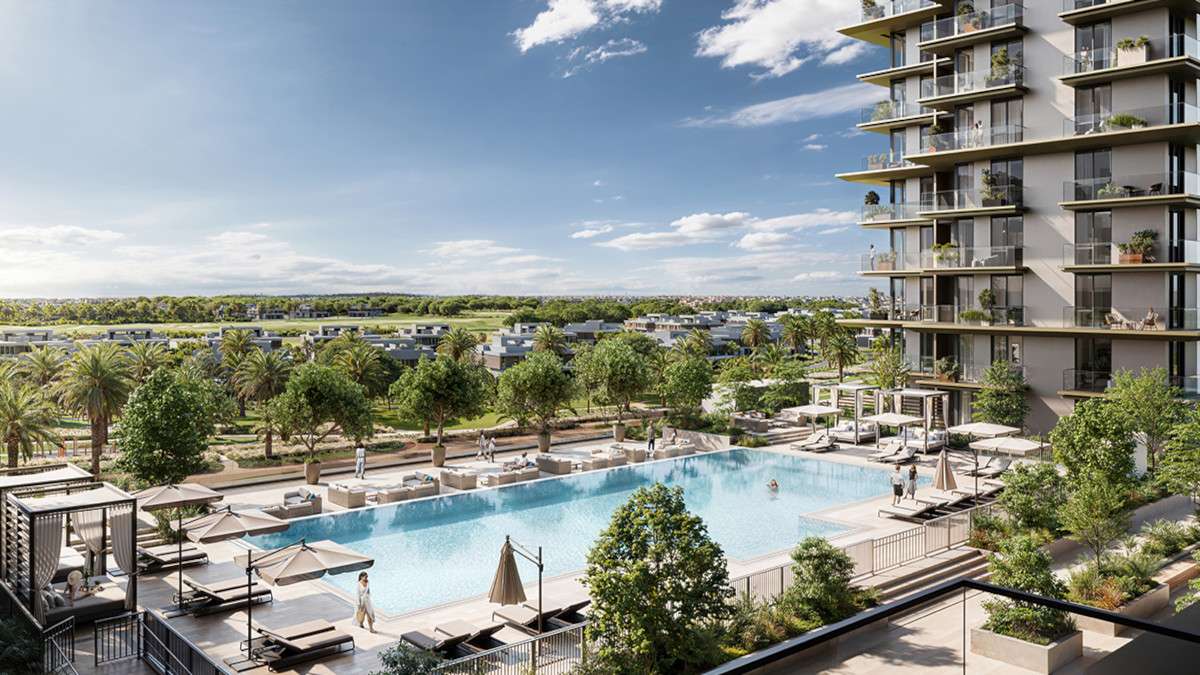
Luxurious Apartments at Club Place, Dubai Hills Estate by Emaar
Source: Building Arabia.
Transaction Summary
By Contract Type
| Contract Type | Number of Transactions | Value (AED) | Value (USD) |
|---|---|---|---|
| New | 1,637 | 563,330,136 | 153,394,796 |
| Renewed | 2,584 | 428,800,960 | 116,762,501 |
| Grand Total | 4,221 | 992,131,096 | 270,157,297 |
By Property Ownership Type
| Ownership Type | Number of Transactions | Value (AED) | Value (USD) |
|---|---|---|---|
| Free Hold | 2,138 | 522,592,697 | 142,301,991 |
| Non Free Hold | 2,083 | 469,538,400 | 127,855,306 |
| Grand Total | 4,221 | 992,131,096 | 270,157,297 |
By Property Usage
| Property Usage | Number of Transactions | Value (AED) | Value (USD) |
|---|---|---|---|
| Commercial | 1,056 | 384,496,461 | 104,698,386 |
| Educational facility | 2 | 80,000,000 | 21,784,000 |
| Health Facility | 2 | 330,000 | 89,859 |
| Industrial | 14 | 3,826,812 | 1,042,041 |
| Residential | 3,119 | 518,251,062 | 141,119,764 |
| Storage | 2 | 174,764 | 47,588 |
| Other | 26 | 5,051,998 | 1,375,659 |
| Grand Total | 4,221 | 992,131,096 | 270,157,297 |
Property Type Breakdown
| Property Type | Subtype | Number of Transactions | Value (AED) | Value (USD) |
|---|---|---|---|---|
| A) Building | 3 | 186,979 | 50,914 | |
| Factory | 2 | 161,979 | 44,107 | |
| Hotel | 1 | 25,000 | 6,808 | |
| B) Land | 17 | 4,635,158 | 1,262,154 | |
| Other | 17 | 4,635,158 | 1,262,154 | |
| C) Unit | 3,750 | 920,121,868 | 250,549,185 | |
| Clinic | 3 | 445,000 | 121,174 | |
| Flat | 2,580 | 319,295,014 | 86,944,032 | |
| Hotel | 22 | 1,914,650 | 521,359 | |
| Labor Camps | 275 | 126,628,411 | 34,480,916 | |
| Mezzanine | 1 | 50,000 | 13,615 | |
| Office | 372 | 178,620,404 | 48,638,336 | |
| Open space | 3 | 189,960 | 51,726 | |
| Restaurant | 2 | 580,000 | 157,934 | |
| School | 2 | 80,000,000 | 21,784,000 | |
| Shop | 365 | 153,837,140 | 41,889,853 | |
| Showroom | 13 | 10,718,204 | 2,918,567 | |
| Store | 5 | 396,760 | 108,038 | |
| Studio | 47 | 16,114,840 | 4,388,071 | |
| Warehouse | 56 | 30,864,115 | 8,404,299 | |
| Warehouse complex | 4 | 467,369 | 127,265 | |
| D) Villa | 236 | 61,432,466 | 16,728,060 | |
| Clinic | 2 | 1,250,000 | 340,375 | |
| Complex Villas | 22 | 3,910,646 | 1,064,869 | |
| Flat | 1 | 380,000 | 103,474 | |
| Restaurant | 1 | 159,000 | 43,296 | |
| Shop | 1 | 159,000 | 43,296 | |
| Villa | 209 | 55,573,821 | 15,132,752 | |
| E) Virtual Unit | 215 | 5,754,625 | 1,567,084 | |
| Office | 212 | 5,579,725 | 1,519,359 | |
| Shop | 2 | 154,900 | 42,179 | |
| Warehouse | 1 | 20,000 | 5,446 | |
| Grand Total | 4,221 | 992,131,096 | 270,157,297 |
Locality Performance
Top 10 Localities by Rental Value
| Locality | Number of Transactions | Value (AED) | Value (USD) |
|---|---|---|---|
| Jabal Ali First | 156 | 99,527,977 | 27,106,568 |
| Al Satwa | 32 | 84,054,528 | 22,884,048 |
| Saih Shuaib 4 | 37 | 54,002,609 | 14,703,510 |
| Jabal Ali Industrial First | 60 | 48,876,051 | 13,307,548 |
| Al Hebiah First | 10 | 47,153,163 | 12,837,623 |
| Business Bay | 218 | 46,857,769 | 12,757,239 |
| Dubai Investment Park Second | 89 | 44,960,668 | 12,240,287 |
| Dubai Investment Park First | 178 | 42,471,803 | 11,563,271 |
| Al Goze Third | 63 | 40,828,092 | 11,115,294 |
| Al Mararr | 101 | 36,528,265 | 9,947,747 |
Other Active Localities
Rental transactions were also recorded across numerous other localities, with a combined annual rental value of AED 446,870,171. These include areas such as Saih Shuaib 2, Al Thanyah Fifth, Burj Khalifa, Marsa Dubai, Palm Jumeirah, Mirdif, Oud Metha, Al Jadaf, Naif, and Al Karama, among others listed in the dataset.
Conclusion
Rental transactions registered on 12 February 2026 covered multiple contract types, ownership structures, property usages, and asset categories. Lease activity was recorded across residential, commercial, industrial, and specialized property subtypes, as reflected in the tables above.
Disclaimer:
This report is based on publicly available data and Dubai Land Department (DLD) transaction summaries as of the date mentioned in the title of this post.
Final and detailed figures from the DLD may vary upon official release.
1 US Dollar = 3.6725 UAE Dirhams
This report is merely informative, and all investments come with risk. You are responsible for your decisions.