Dubai Real Estate Sales Transactions 31 March 2026
Dubai Real Estate Sales Transactions Report
Date: 31 March 2026
A total of 1,167 sales transactions were registered, with a combined value of AED 2,879,468,213. Transaction activity was primarily concentrated in standard sales, which accounted for the majority of both volume and value during the day.
Distribution across property status remained balanced, with off-plan and ready properties contributing nearly equal shares of total value. Residential transactions represented the dominant segment in both volume and overall consideration.
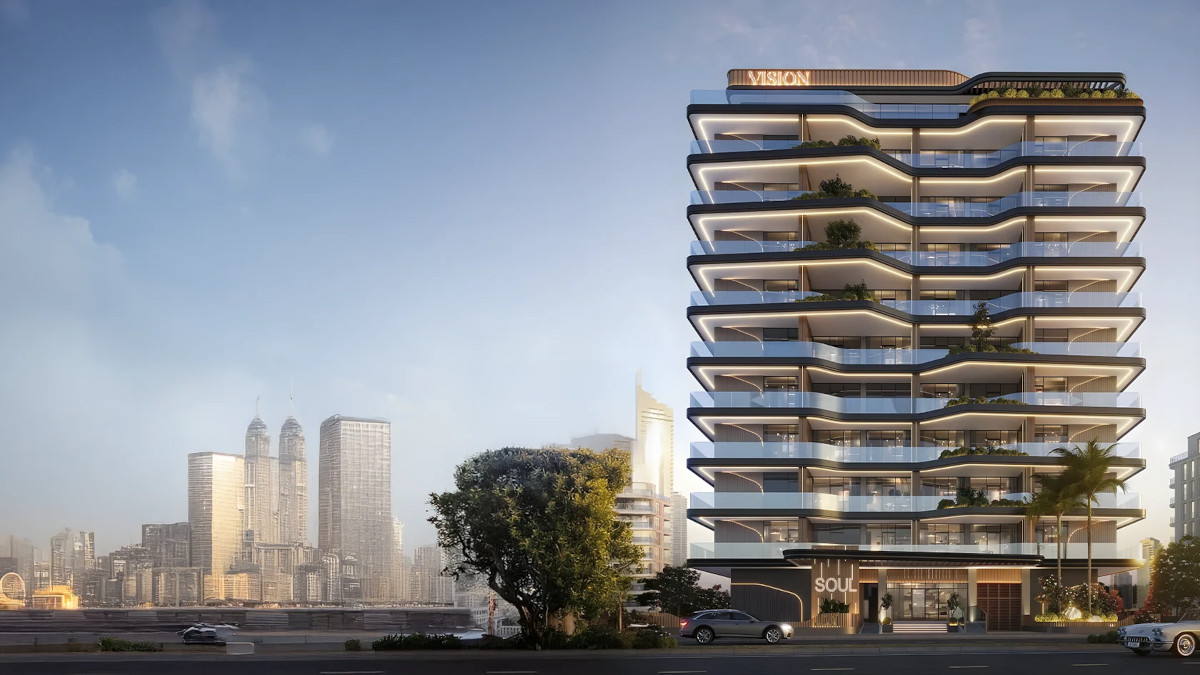
SOUL by Vision at Production City, Dubai – Modern Apartments
Source: Building Arabia.
Transactions by Sales Type
| Category | Number of Transactions | Value (AED) | Value (USD) |
|---|---|---|---|
| Gifts | 28 | 67,539,206 | 18,390,526 |
| Mortgage | 216 | 544,091,335 | 148,152,848 |
| Sales | 923 | 2,267,837,672 | 617,518,767 |
| Grand Total | 1167 | 2,879,468,213 | 784,062,141 |
Transactions by Property Status
| Category | Number of Transactions | Value (AED) | Value (USD) |
|---|---|---|---|
| Off-Plan | 726 | 1,437,840,033 | 391,515,326 |
| Ready | 441 | 1,441,628,180 | 392,546,815 |
| Grand Total | 1167 | 2,879,468,213 | 784,062,141 |
Transactions by Property Ownership Type
| Category | Number of Transactions | Value (AED) | Value (USD) |
|---|---|---|---|
| Free Hold | 1142 | 2,734,976,442 | 744,717,888 |
| Non Free Hold | 25 | 144,491,771 | 39,344,253 |
| Grand Total | 1167 | 2,879,468,213 | 784,062,141 |
Transactions by Property Usage
| Category | Number of Transactions | Value (AED) | Value (USD) |
|---|---|---|---|
| Commercial | 28 | 430,515,067 | 117,226,690 |
| Residential | 1139 | 2,448,953,146 | 666,835,451 |
| Grand Total | 1167 | 2,879,468,213 | 784,062,141 |
Transactions by Property Type
| Category | Number of Transactions | Value (AED) | Value (USD) |
|---|---|---|---|
| A) Building | |||
| Villa | 70 | 233,582,920 | 63,603,246 |
| Subtotal | 70 | 233,582,920 | 63,603,246 |
| B) Land | |||
| Commercial | 27 | 405,515,067 | 110,419,351 |
| General Use | 5 | 103,852,279 | 28,279,586 |
| Government Housing | 1 | 300,000 | 81,688 |
| Industrial | 1 | 25,000,000 | 6,807,352 |
| Land | 2 | 15,500,000 | 4,220,558 |
| Residential | 57 | 234,564,640 | 63,870,562 |
| Residential / Residential Villa | 1 | 1,000,000 | 272,294 |
| Residential / Villas | 1 | 4,505,000 | 1,226,685 |
| Villa | 2 | 19,050,000 | 5,187,202 |
| Other | 6 | 42,742,398 | 11,638,502 |
| Subtotal | 103 | 852,029,384 | 232,002,555 |
| C) Unit | |||
| Flat | 948 | 1,617,796,064 | 440,516,287 |
| Hotel Apartment | 9 | 10,305,000 | 2,806,000 |
| Hotel Rooms | 6 | 4,169,770 | 1,135,404 |
| Office | 27 | 153,622,712 | 41,830,555 |
| Shop | 4 | 7,962,363 | 2,168,104 |
| Subtotal | 994 | 1,793,855,909 | 488,456,340 |
| Grand Total | 1167 | 2,879,468,213 | 784,062,141 |
Top 10 Localities by Value
| Locality | Number of Transactions | Value (AED) | Value (USD) |
|---|---|---|---|
| JUMEIRAH VILLAGE CIRCLE | 82 | 186,925,536 | 50,898,716 |
| Madinat Al Mataar | 94 | 175,150,481 | 47,692,439 |
| BUSINESS BAY | 58 | 144,250,659 | 39,278,599 |
| DUBAI HEALTHCARE CITY - PHASE 1 | 2 | 138,000,000 | 37,576,583 |
| Me'Aisem Second | 5 | 103,852,279 | 28,279,586 |
| Jabal Ali First | 52 | 103,209,113 | 28,104,592 |
| Al Yelayiss 5 | 13 | 97,624,544 | 26,582,585 |
| Trade Center Second | 4 | 93,028,850 | 25,331,205 |
| Al Khairan First | 19 | 67,021,436 | 18,249,540 |
| BURJ KHALIFA | 18 | 66,232,143 | 18,034,620 |
A total of 96 other localities recorded activity during the period, with a combined value of AED 1,707,373,565. Notable activity beyond the top tier included Al Hebiah Fifth, Palm Deira, and Dubai Land Residence Complex.
Conclusion
Sales transactions were led by standard sales contracts, with mortgages and gifts representing a smaller share of total activity. Free Hold ownership accounted for the majority of both volume and value.
Residential properties dominated the market, supported primarily by unit transactions, particularly flats. Off-plan and ready segments recorded similar total values, with off-plan leading in transaction volume.
Disclaimer
This report is based on publicly available market transaction summaries and compiled data related to Dubai real estate activity for the stated period.
Figures are presented for informational purposes only and may vary from final official statistics published by the Dubai Land Department (DLD).
1 US Dollar = 3.6725 UAE Dirhams
This material does not constitute financial or investment advice. Real estate investments involve risk and readers should conduct independent research before making any investment decisions.