This Basic 60d Technical Analysis Predicts STEEM may drop to 0.165.
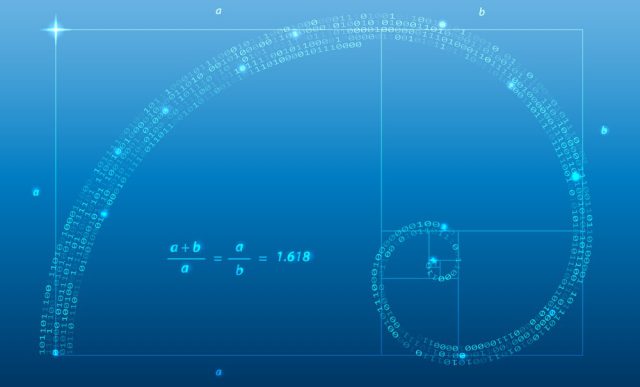
The Human Factor and The Golden Ratio
We clearly are still primarily biological entities and as such are generally subject to the laws of nature. The Golden Ratio is found in nature and evident in the Fibonacci Sequence: 1,1,2,3,5,8,13...to infinity. It has been studied and used by artists, mathematicians and scientist through the ages (a mathematical symbol for the ratio, 'phi' derives from the ancient Greek sculptor Phidias who is said to have employed it in his works).
It is found everywhere from plant and animal characteristics, to the astronomical properties of stars.
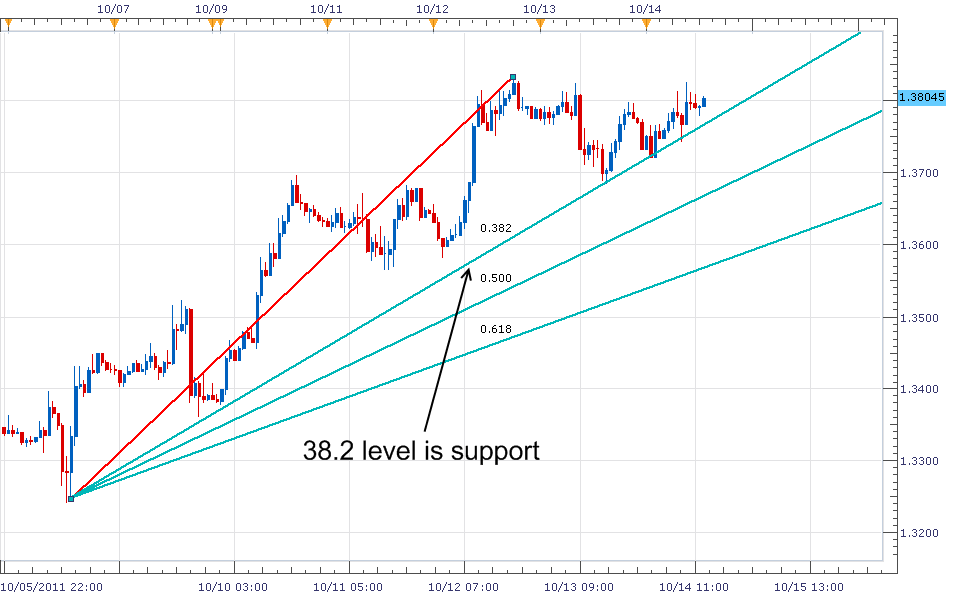
More recently, financial trade analysis has employed this and other Fibonacci Ratios to identify points of resistance for prices of tradable commodities. Of course, there is a big difference between manifest patterns in nature, and the strategies employed by individuals looking for profit. One is inanimate, the other can be more of a self-fulfilling prophecy as automated systems, and learned patterns of the crowd simply manifest themselves. If there is an identifiable correlation, it will be leveraged by those who have the insight.
Psychology of buyers and sellers is one of many factors affecting price - others may be external events and new information which reset the value based on new information. Additionally, if a company continuously operates at a loss - with no prospects for profitability, it is on a trajectory to zero (regardless of any fancy ratios that may fluctuate a price of its shares).
Key Fibonacci Ratios
- 61.8%: n / (n + next number to the right in the sequence)
- 38.2%: n / (n + two numbers to the right in the sequence)
- 50.0%: second number (1) / third number (2)

https://en.wikipedia.org/wiki/Fibonacci_retracement
STEEM Price - Basic Analysis of 60 day Trend
The following simple analysis was done by taking the drops in price over the last 60 days, and identifying the % increase following the low.
Calculations are my own and are for educational purposes only.
Underlying data for the STEEM/USD price was sourced from: https://www.coingecko.com/en/price_charts/steem/usd/60_days
Based on these 4 price rises after lows (for the 3rd rise, 63% is used), the average upswing following a new low is 35.25%. The upswings appear to demonstrate some consistency with Fibonacci Ratios.
Furthermore, the four drops over the 60 days were 41%, 39%, 43%, and 57% for an average of 45%. If we were to project this out, the trend would suggest that there is more downside potential before a significant bump up. Under this model, the current price of 0.2330 / USD would continue towards 0.18 (if we take a 40% lower as our valley), or 0.165 if we use the 45% average for the 60 day period.
Ultimately this simplistic analysis has no insight into outside factors, or even the innate supply dynamics related to STEEM production. It relies on two factors: a very basic Fibonacci Ratio and the current trend over the last 60 days with its 4 peaks and valleys.
The next couple of weeks should show if this holds any water, and perhaps there will be indications (using additional factors - such as moving averages) that a trend reversal is underway.
Upvoted and followed!
Interesting prediction method upvoted.
i'm quite curious to see the next 10 days...it is possible the last 'bounce' was something out of pattern (only 11%), so the next leg up could be quite substantial. Of course the 'external factors' such as supply increase, may also be in play - so we'll see. thanks.