You are viewing a single comment's thread from:
RE: Problem With Relying on Financial Charts
Technical analysis has to be applied on top of fundamental analysis, use both to identify better trading opportunities. I have had several conversations with Clive on skype and emails, he is a good technical chartist. Even the chart above shows a slight down move first in the blue arrow before rising significantly. Its hard to predict when the bullion banks and the London Fix will slam gold and silver, they do like to do it at key points.
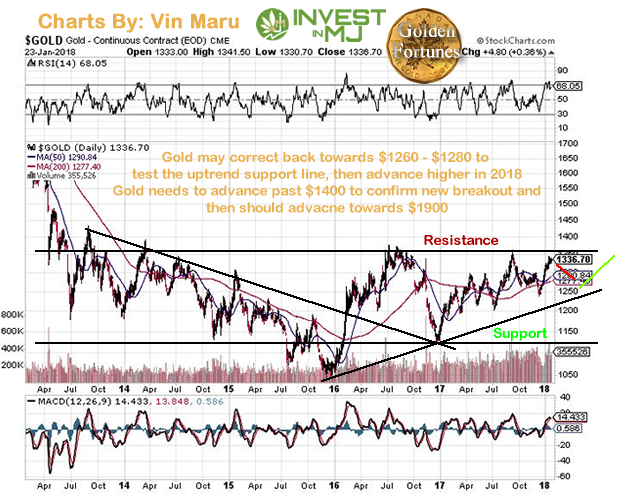
Once this move down is complete (probably this week), the next move is most likely up and needs to break above the downtrend line identified above. I mentioned the same trading pattern in a recent blog, here is my chart on Gold.

I do respect Clive that is why I started my post with a mention that I have followed Clive for years and find him to been a good analyst. That being said I follow your point to use the technical in conjunction with the fundamental but still the chart is call it deformed by the manipulation. I don't know a way to filter out the paper trades from the chart. One idea is to chart using a longer time base. I think if you expand the time it will dilute the time when heavy manipulation occurred and include more data when there was less manipulation.
There is a way I can see but it is not a feasible option. This is to do away with paper contracts unless they are fully backed by the physical. Also stop allowing HFT by algorithms. In response to your point that 'it's hard to predict when the bullion bank (commercials) and the London Fix with smash the precious metals, I agree that you can't predict the exact timing but you can get darn close. Watch about 10AM (eastern time) and if they are going slam it, it will normal occur around then.
I appreciate your insightful comment and I will check out your post. I am always looking for other (intelligent) viewpoints.