A quick look at Steem inflation as 2023 comes to a close
As 2023 comes to a close, the price of STEEM has spent the last month or so flirting with the SBD print threshold where 10% of the market capitalization is allocated to debt in the form of SBD. As a result, the blockchain has printed SBDs for author rewards in fits and starts. This dynamic leads to some interesting effects on Steem's observed inflation rate.
Accordingly, I thought it would be interesting to update the inflation tables and graphs that I previously published back near the end of September.
Before I start, however, let me just repeat that this is my understanding of things, but since there is no authoritative document, there could certainly be errors here. I don't guaranty that this information is correct. "Buyer Beware", "Caveat Lector", and so forth... 😉. Please let me know if you observe any errors or misunderstandings.
Now, let's recall that in September, the peak of blockchain inflation (in terms of new STEEM per day) was modeled to occur between February 4 and February 12, with a peak value of 89,947. As previously noted, there are multiple factors that can change the actual results as compared to the modeled result, so what do we see if we look again now?
1. The peak is still modeled to occur in February, but the peak value is now projected to be 89,889 STEEM per day. This is down by 58 from the September projection, and just 4 STEEM per day higher than the current value, so for all intents and purposes, we can say that we're already at the peak of daily STEEM production.
| Date | Block # | Inflation Rate | Supply | New Steem Per Day |
|---|---|---|---|---|
| 2024-01-01 12:43:56.609005 | 81250000 | 0.065300 | 502423187 | 89885 |
| 2024-01-10 05:03:56.609005 | 81500000 | 0.065200 | 503203452 | 89887 |
| 2024-01-18 21:23:56.609005 | 81750000 | 0.065100 | 503983729 | 89888 |
| 2024-01-27 13:43:56.609005 | 82000000 | 0.065000 | 504764017 | 89889 |
| 2024-02-05 06:03:56.609005 | 82250000 | 0.064900 | 505544309 | 89889 |
| 2024-02-13 22:23:56.609005 | 82500000 | 0.064800 | 506324604 | 89889 |
| 2024-02-22 14:43:56.609005 | 82750000 | 0.064700 | 507104898 | 89889 |
| 2024-03-02 07:03:56.609005 | 83000000 | 0.064600 | 507885186 | 89888 |
| 2024-03-10 23:23:56.609005 | 83250000 | 0.064500 | 508665465 | 89887 |
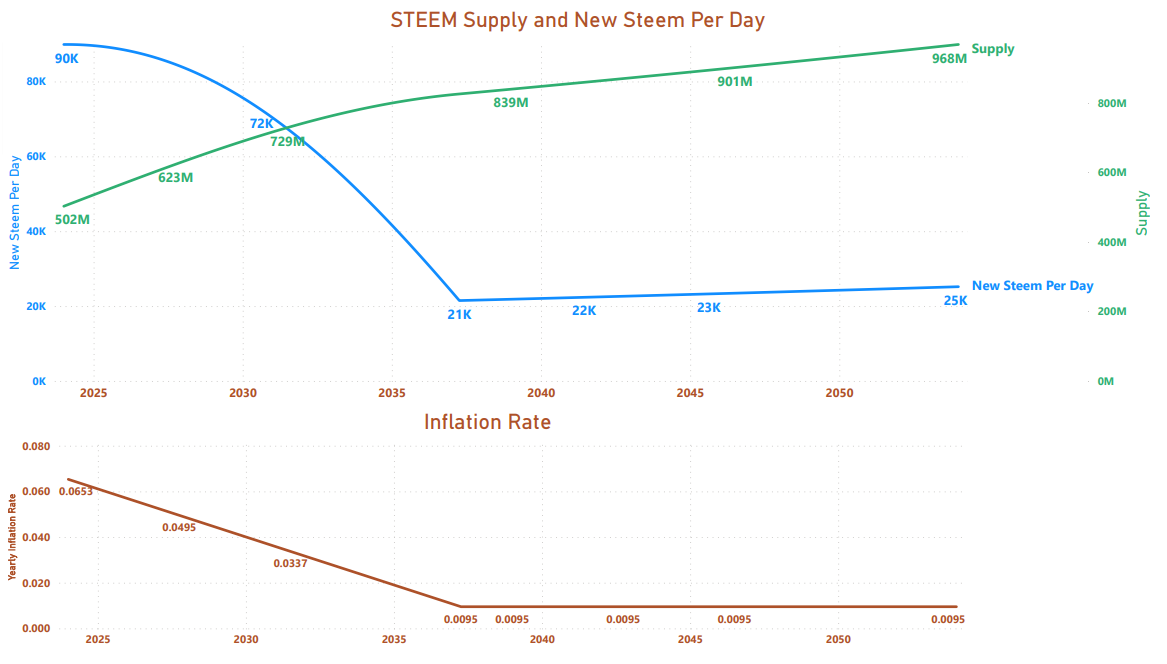
2. Here's what the curves look like for 1 year, 4 years, 8 years, 12 years, and 20 years
Note that (all else being equal) daily STEEM production is expected to be flat (with a barely observable decline) for about a year, and then to start declining at a rate that accelerates continuously until 2037, when it levels out and starts to claw its way back up again.

3. Here's a simple graph showing the inflation rate, virtual supply, and Steem production for the next 30 years
Note that the virtual supply has increased from about 494 million in September to about 502 million today. This value is about 51.8% of the projected value at the end of 2053 (subject to influence by other factors). (Recall that in October, the corresponding percentage was 51.4%.)
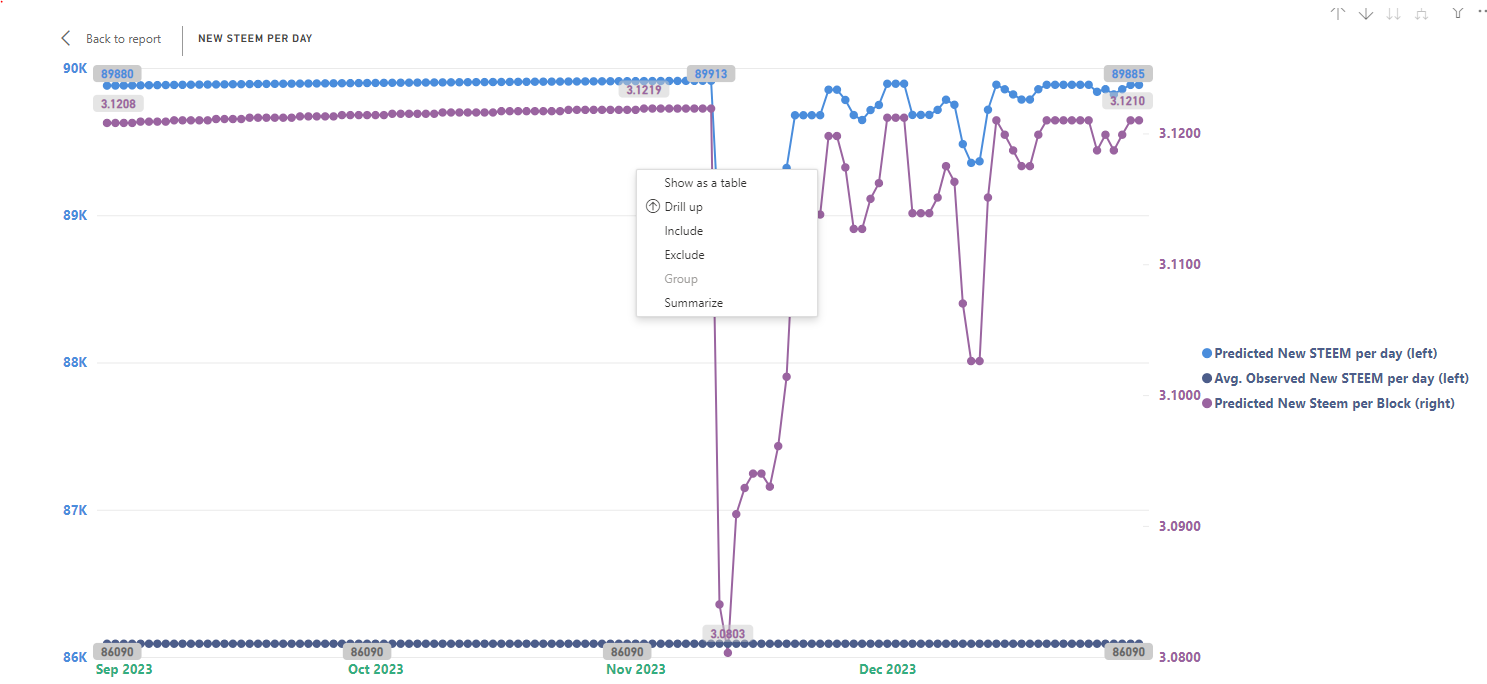
4. The interesting thing this quarter is that other factors made themselves visible due to crossing the 10% SBD printing threshold.
The blockchain inflation rate ends the year at 6.53%, but the observed inflation rate during the last quarter ~4 months was just 6.39%.

And the net daily STEEM production, after accounting for changes in the ratio between SBD and STEEM has averaged at 86K, which represents a 4% decline vs. the theoretical rate of increase. This is also down from an average of about 88K when I posted back in September.
5. What other factors influence the inflation rate
I don't know if I'm aware of all factors, but here are the ones that I know of:
Things that decrease inflation (and daily STEEM production)
- Burning tokens (as-in #burnsteem25 or post promotion) can reduce the observed inflation rates.
- Increases in the price of STEEM (only when above the SBD print threshold) can reduce the observed inflation rates.
- Missed blocks by witnesses can reduce the observed inflation rates.
Things that increase inflation (and daily STEEM production)
- Decreases in the price of STEEM (only when above the SBD print threshold) can increase the observed inflation rates.
- If Witnesses start paying interest on SBDs held in savings, I believe this would increase the observed inflation rate.
There may also be other factors that I'm not aware of.
Summary
Basically, unless the witnesses suddenly and unexpectedly start paying interest on SBD savings, it appears that we are approaching the theoretical peak in daily STEEM production, and we might well have already passed the actual peak. In practical terms, based on the net new STEEM per day and observed inflation rates, we seem to be running about 1/2 year to 3 years in front of the theoretical inflation curve.
Thank you for your time and attention.
As a general rule, I up-vote comments that demonstrate "proof of reading".

Steve Palmer is an IT professional with three decades of professional experience in data communications and information systems. He holds a bachelor's degree in mathematics, a master's degree in computer science, and a master's degree in information systems and technology management. He has been awarded 3 US patents.

Pixabay license, source
Reminder
Visit the /promoted page and #burnsteem25 to support the inflation-fighters who are helping to enable decentralized regulation of Steem token supply growth.
Here outside the post. I want to wish you a happy new year, may GOD grant you excellent health and very happy moments with yours
Thank you! And I wish a happy & prosperous 2024 for you.
Measures should be taken to reduce Steem inflation. Maybe a 3rd new coin can be added to the system. This token can be used for witness selection and propolsals. After doing these, a team should be established for advertising.
Inflation will start going down on its own fairly soon. I'd like to see an invigorated focus on raising demand.
This post has been featured in the latest edition of Steem News...
Thank you for including this. Happy 2024!