Steem Total Value Powered Up - $39 million - October 30, 2022
This is next in my series of posts reviewing the amount and value of powered up STEEM on the Steem blockchain. For previous posts, see the end of this entry.
Noteworthy in the last week |
|---|
- Week over week, the number of powered up STEEM increased by about 230K SP, or 0.14%.
- Over the course of the week, we saw six daily increases and six new highs in the number of staked STEEM. The current streak of consecutive new highs stands at two.
- The modeled value gained ground against USD, SBD, and TRX. It lost ground against BTC, ETH, and LTC. Changes ranged from -13.9% against ETH to +3.5% against USD.
- In terms of all comparison values except for TRX and USD, the modeled value remains above its January 1 baseline.
- In terms of all comparison tokens except TRX and USD, the modeled value is above its long term average. For ETH, it is just barely so.
- This week (Sunday through Saturday) saw a total of 320K STEEM powered down, which is a decline of about 10% as compared to last week's 357K STEEM.
Here are the numbers as-of a few minutes ago |
|---|
Total value locked in powered-up STEEM (USD): $38,766,036.14
STEEM market cap $92,353,612.77
Locked value in terms of other tokens:
| token | price | locked value equivalent | Jan 1, 2022 | pct of Jan 1 baseline |
|---|---|---|---|---|
| tron | $0.06 | 614,426,895 | 809,173,538 | 75.93% |
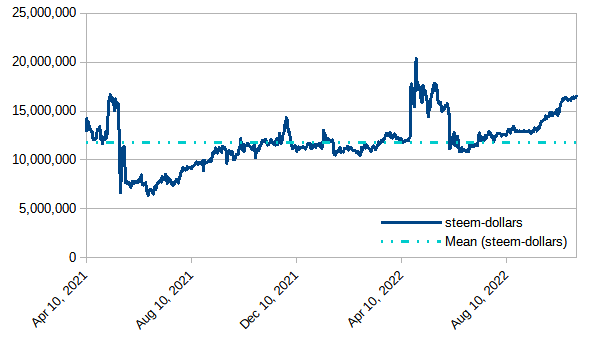
| steem-dollars | $2.31 | 16,781,833 | 11,284,131 | 148.72% |
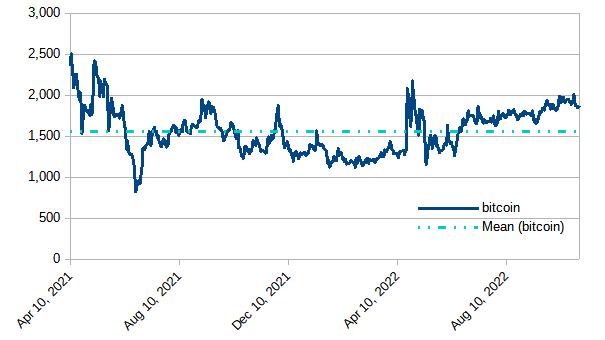
| bitcoin | $20,574.00 | 1,884 | 1,300 | 144.96% |
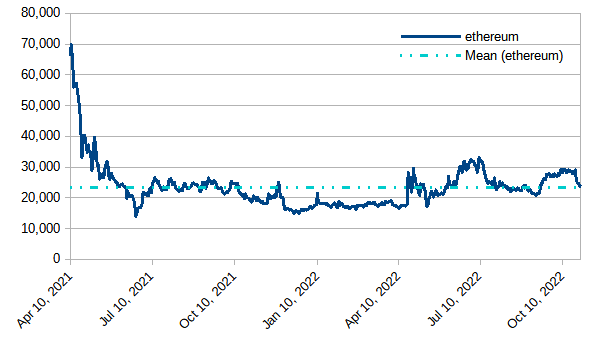
| ethereum | $1,581.29 | 24,515 | 16,501 | 148.57% |
| litecoin | $54.99 | 704,965 | 411,561 | 171.29% |
| steem | $0.23 | 165,322,752 | 142,930,214 | 115.67% |
| USD | $1.00 | 38,766,036 | 61,837,042 | 62.69% |
|
|---|
Daily Changes
Here is a chart of daily changes in powered-up STEEM from April 11, 2021 to present. The graph also includes a linear trend line and a 28 day moving average.
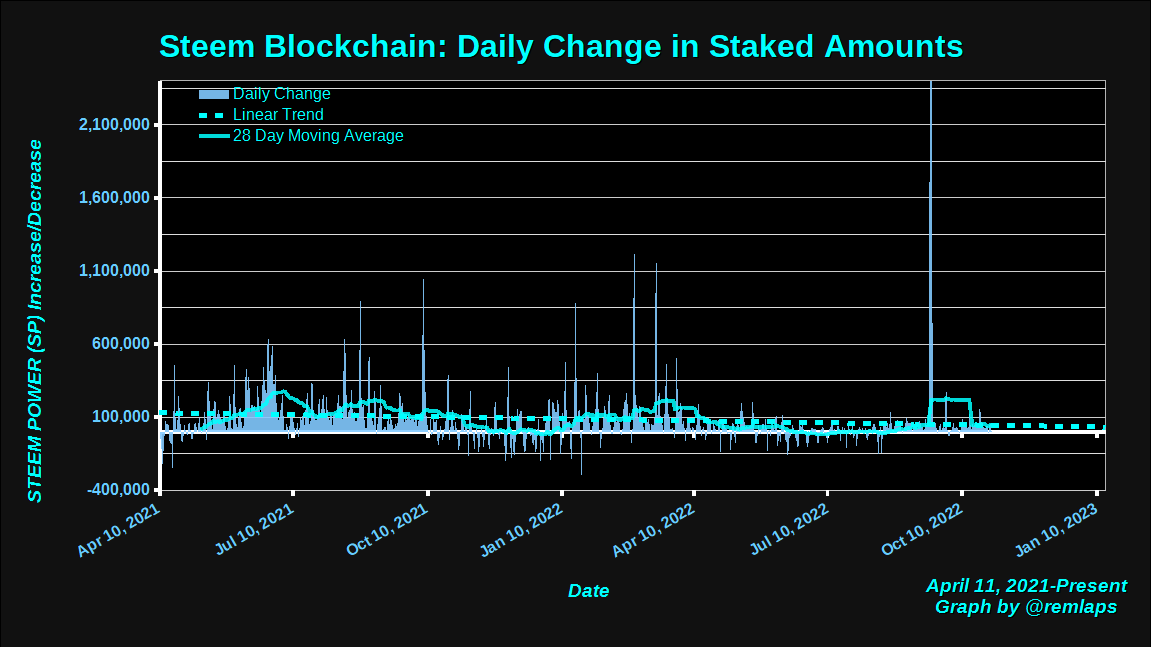
Here are some descriptive statistics, for numbers geeks.

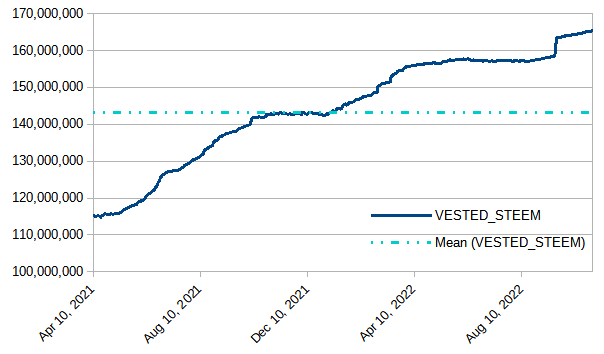
VESTED STEEM
Today's observed value was 165,313,958, which is up by ~230K, or 1/10% from last week's observed value. The graph retains a slightly perceptible upslope.
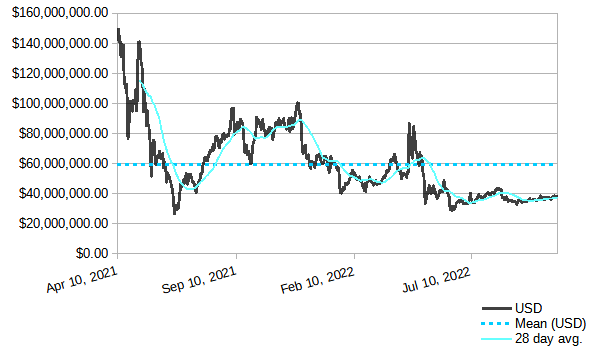
Modeled value of powered-up STEEM in terms of USD
In terms of USD, we saw a weekly increase of about $1.3 million or roughly 3 1/2%. The value is still below the long-term mean, and holds above its recent low near $34 million. It also remains above the low of ~27 million from June 22, 2021.
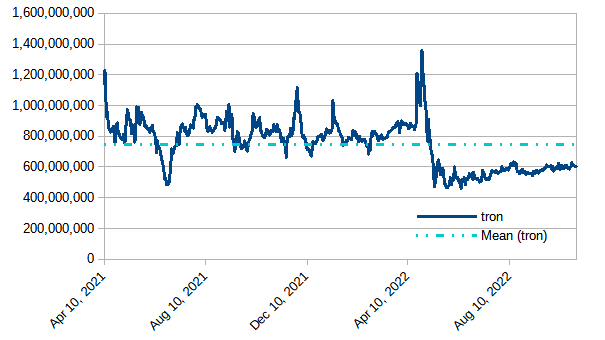
Modeled value of powered-up STEEM in terms of Tron (TRX)
Powered-up STEEM gained ground by about 2.7 million tokens against TRX or about 1/2%.
Modeled value of powered-up STEEM in terms of Steem Dollars
Up by about 560K SBDs or about 1/2%
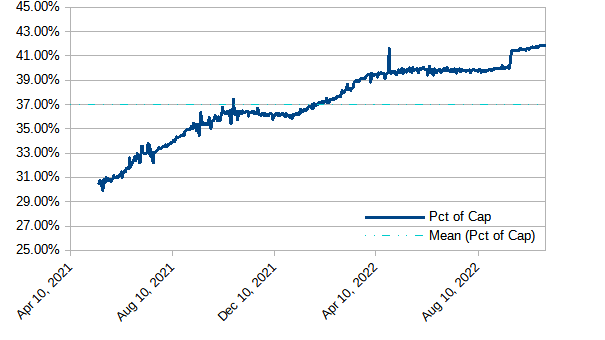
Modeled value of powered-up STEEM as a percentage of Steem's market cap
After today's observed value of 41.85%, the graph continues to show a barely perceptible upslope. We also saw a new high of 41.87% yesterday, October 29 (Saturday). We have now seen 42 consecutive days above 41%; 209 consecutive days above 39%; 273 consecutive days above 37%; 400 consecutive days above 35%; and 463 straight days above 1/3. Will it hold above 41%? Will it climb above 42%
Modeled value of powered-up STEEM in terms of bitcoin (BTC)
Down by about 67 BTC, or 3 1/2% during the week.
Modeled value of powered-up STEEM in terms of Ethereum
After an explosive week for Ethereum, Powered-up STEEM lost ground by roughly 4,000 ETH, or a little under 14%.
Modeled value of powered-up STEEM in terms of LTC
Lost ground by about 10K LTC, or about 1 1/2%.

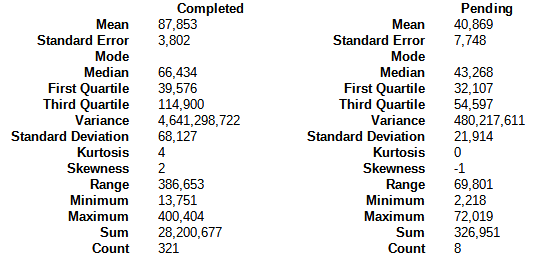
Daily Powerdown Activity
Here is graph with data from steemdb.io to show daily completed and pending powerdown activity. With 320K in completed powerdowns last week and 316K pending (both measured from Sunday through Saturday), we can expect powerdowns to decrease next week by about 1 1/2% or less.

The horizontal lines are the average values for completed (blue) and pending (cyan) powerdowns, and the yellow line is a 28 day moving average of completed powerdowns. "Pending" numbers now come from the Steemit API, not from steemdb.io.
Here are some descriptive statistics for the numbers geeks
| And with a total of 1,399 pending power downs (up from 1,392 last week), here are the times, dates, and amounts of the top-10 |
|---|
1 2022-11-06T16:02:27 - 105,922,485 MVESTS, 59,058 STEEM
2 2022-11-01T23:25:06 - 27,810,689 MVESTS, 15,506 STEEM
3 2022-11-04T11:11:21 - 21,324,320 MVESTS, 11,890 STEEM
4 2022-11-01T16:51:09 - 17,952,918 MVESTS, 10,010 STEEM
5 2022-11-03T15:33:24 - 17,950,100 MVESTS, 10,008 STEEM
6 2022-11-04T11:10:57 - 16,897,684 MVESTS, 9,422 STEEM
7 2022-11-04T16:15:57 - 13,071,148 MVESTS, 7,288 STEEM
8 2022-11-02T19:16:09 - 11,222,359 MVESTS, 6,257 STEEM
9 2022-11-01T03:17:57 - 10,419,114 MVESTS, 5,809 STEEM
10 2022-10-31T16:04:03 - 7,626,413 MVESTS, 4,252 STEEM
Notes
- Reference prices for STEEM and other tokens are downloaded from coingecko.com
Previous posts
- Steem Total Value Powered Up - $34 million - July 3, 2022
- Steem Total Value Powered Up - $37 million - July 10, 2022
- Steem Total Value Powered Up - $36 million - July 17, 2022
- Steem Total Value Powered Up - $38 million - July 24, 2022
- Steem Total Value Powered Up - $41 million - July 31, 2022
- Steem Total Value Powered Up - $41 million - August 7, 2022
- Steem Total Value Powered Up - $43 million - August 14, 2022
- Steem Total Value Powered Up - $38 million - August 21, 2022
- Steem Total Value Powered Up - $36 million - August 28, 2022
- Steem Total Value Powered Up - $37 million - September 11, 2022
- Steem Total Value Powered Up - $36 million - September 18, 2022
- Steem Total Value Powered Up - $36 million - September 25, 2022
- Steem Total Value Powered Up - $35 million - October 2, 2022
- Steem Total Value Powered Up - $38 million - October 9, 2022
- Steem Total Value Powered Up - $37 million - October 16, 2022
- Steem Total Value Powered Up - $37 million - October 23, 2022
- Steem Total Value Powered Up - $39 million - October 30, 2022
For links from 2021 and the first half of 2022, see these posts:
- Steem Total Value Powered Up - $67 million - January 2,
20212022 - Steem Total Value Powered Up - $36 million - June 26, 2022
- Steem Total Value Powered Up - $36 million - June 26, 2022

Pixabay license, source
Reminder
Visit the /promoted page and #burnsteem25 to support the inflation-fighters who are helping to enable decentralized regulation of Steem token supply growth.
Forecasts point to an increase at the end of the year of all cryptocurrencies, hopefully it will be a gift from Santa Claus
Thanks for the helpful report, it is important to follow the movements of the coin. She will still show her good side.
I like that the cost remains within certain limits. This week I saw the minimum price of steam at 0.00001105 BTC. Thanks for the report!
This post has been featured in the latest edition of Steem News...
More than 33% of circulating steems are powered. This is actually a high rate. When we look at other cryptocurrencies, we cannot find such a high rate.