Steemit Crypto Academy Contest / S20W5: Trading with Harmonic Patterns
Hello everyone, I hope you all are doing well. I am here to share my participation for Steemit Engagement challenge season 20 week 5. This season crypto academy tasks are getting tough each week but I will try to share my participation again.

[Canva Design](
Question 1: Explain the Key Harmonic Patterns
Butterfly Harmonic Pattern
So firstly I would like to define butterfly pattern
This is a simple word we can say reversal pattern which is made up of 4 legs a leg which is floating around and this is a strong connection between high swing and the low swing.
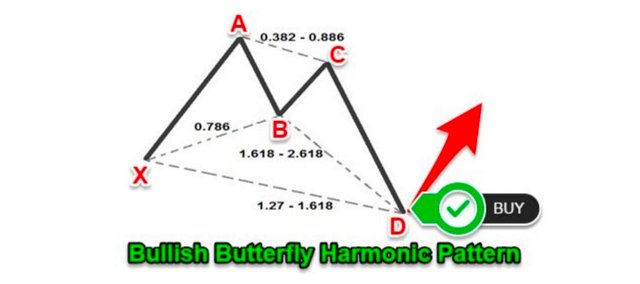
You can see in this diagram Ab=0.786 or simply you can say this is the retracement of two legs XA 78%
BC= 38% mini - Maximum 88% and BC is mainly the swing legs of AB
CD= mini 1.617 - maximum 2.16 swing AB
So this diagram is telling us about the bullish butterfly harmonic pattern.
So the main dependency of harmonic pattern for the butterfly is clearly on the point B why because it is describing its infrastructure setups and providing and predicting about the trade opportunities.
And be it should be or must be rightly 78 percent retracement of one of the most important XA.
Another thing which you should know about the butterfly pattern is AB= CD this equivalency must be present and this is the shortest criteria for trading and you can also use other ways for example CD=1.27 this is another important structure.
So this was the important point but if you wanted to know the critical number in the reversal zone which is clearly the 1.27 XA. So this was the whole once you know these things than you just analyse the first two legs of the pattern.
Once you know the important points as I mention A, B and X then you can start the technical analysis of the price in the market and our important wave C will clearly define all the rules and regulations for butterfly pattern. Now in this graph you can clearly see I have tried to give the pattern of butterfly bullish pattern.
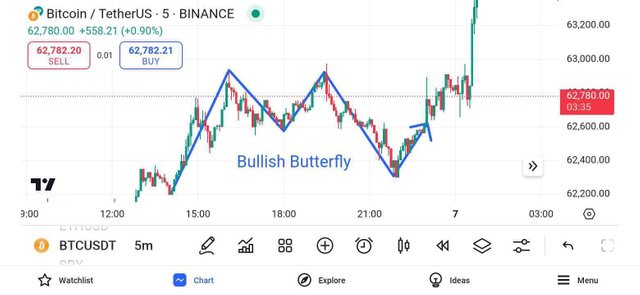
So I am using Steem/USDT chart prices you need to select the harmonic pattern from the trading view and then afterwards you just need to focus on swing whether high or low once you are able to identify the first high and low swing then you just need to do that technical analysis of the market in this graph I have tried to show the market prices are going up and this is the classical example butterfly bullish Pattern.
Bat Harmonic Pattern
Firstly I will define some rules for bat pattern and then I will show you in the graph this is also a reversal pattern of 4 legs that is following the fibonacci pattern.
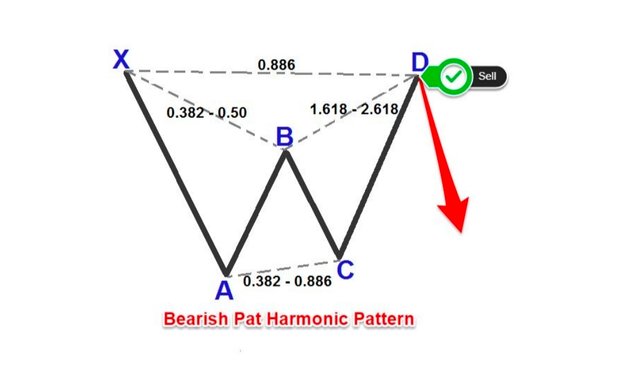
AB = I will tell you about the minimum percentage and the maximum percentage for fibonacci retracement of XA.
Mini is 38% ,max 50% Fibonacci retracement of XA leg
BC = mini 32% ,max 88% Fibonacci retracement of AB leg
CD =88% Fibonacci retracement XA - 2.216 fibonacci extension of AB leg.
So when you are going to see any pattern whether bullish or bearish pattern you first need to stick to the XA leg.Next for technical analysis you need to see the minimum .382 Fibonacci retracement of XA and it can go as widely UpTo 0.50.
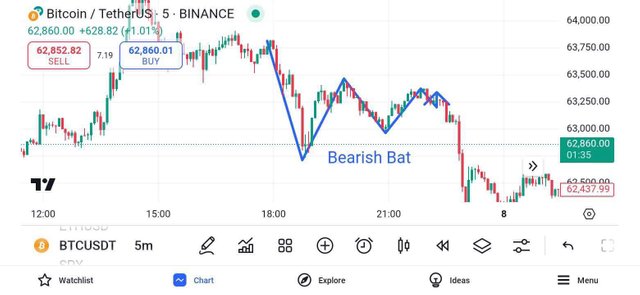
So I am using Steem/USDT price chart after selection I am graphically showing a bearish bat pattern okay so first you need to select the indicator harmonic pattern and then first you need to identify the X as I already mentioned you need to find high or low swing.
Once you find it then you just need to focus on market analysis. So here I am showing the graph of bearish bat which means that the market prices are going down and you can see the technical analysis by this graph. I hope this is clear to you.
Gartley Harmonic Pattern
Now I am going to tell you about gartley and this is also going to follow fibonacci rules.
AB= 0.618 of Fibonacci retracement of XA
BC= mini 38 and max 78 percent of Fibonacci retracement AB leg.
CD= 1.27-1.618 Fibonacci extension of AB leg
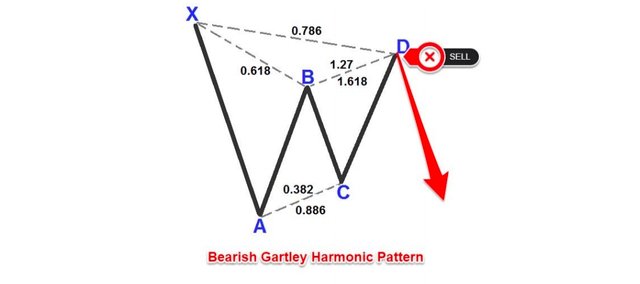
So I am going to solve one more solution as well that the butterfly and gartley are very similar and some of the rules are very similar to each other.As so I am going to show you the bearish gartley harmonic pattern this is classical by following the double top and it also have double bottom so it is showing us the huge surface areas for reversal in the market. Why this is happening because this is going to give us the bi directional trading in the market.
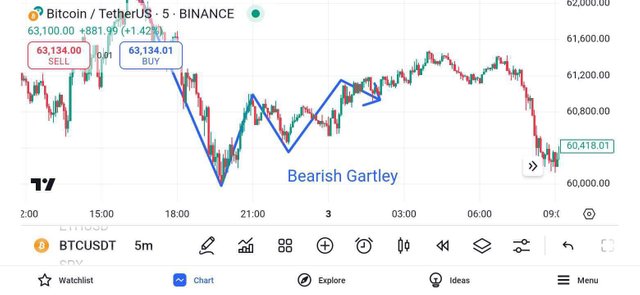
So now I am defining it by the classical presentation on the graph I have opened up the trading view and then selected the indicator of harmonic pattern then as I mentioned earlier you need to identify high and low swing.In this graph after the technical analysis of the market prices it is showing bearish pattern market prices are going down.
Crab Pattern
Now I am going to tell you about the crab pattern This is meeting the criteria of
AB= 0.382-.618 Fibonacci retracement of XA leg
BC= 38 and 88 percent of Fibonacci retracement
CD = 2.25-3.618 Fibonacci extension of AB leg
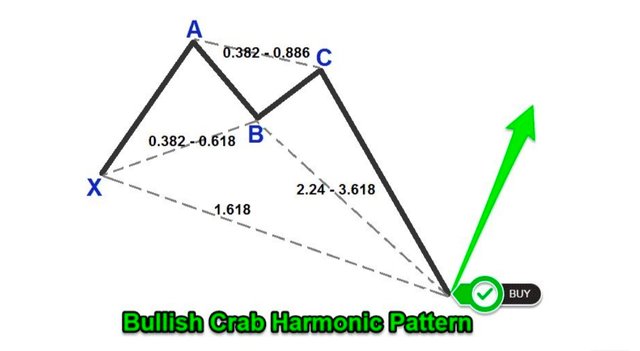
Fibonacci retracement this is basically the core heart of harmonic trading and you must need to master it. This is one of the pattern which is called the extreme hormonic patterns means as I told you that the prices are always volatile in the market and this is basically entering into the potential reversal zone.
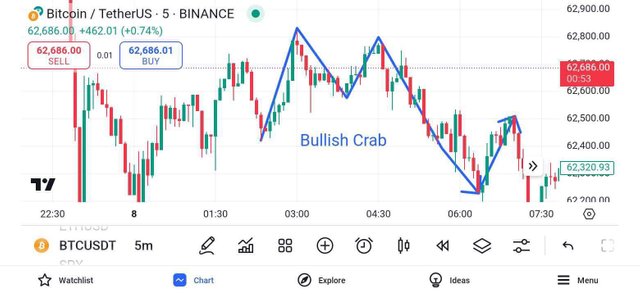
Now I am showing you and the graphical on presentation on the graph and on trading view first in just technical analysis you need to fix X point and high swing and low wing after that you just do that technical analysis at this is the classical presentation of bullish crap which means that market prices are going up.I hope this is clear to you.
Question 2: Identifying Harmonic Patterns on a Steem Chart
I am using a trading view I am using the price chart of Steem/ USDT and I have identify the bearish crab now I will explain the potential price in the market. I have already mentioned in my last question how we can draw the crab pattern first you need to apply the harmonic indicator just on the right side of trading view.
Then the most important thing is to identify the x to start the chart and then do the technical analysis of high swing and low swing. After doing this all you just need to do that technical analysis so this is the Bearish crap pattern.
Normally any trade takes place almost near to the point D. What would be the length of D we cannot predict.Once at least reversal zone should be achieved at minimum level minimum level. The point D should make the criteria.CD=2.24-3.6 of AB leg.
Once you have been successful in identifying the D point then you should just focus on the trend reversal and need to generate profit.And this is the point where you can sell between these two points of Fibonacci retracement.
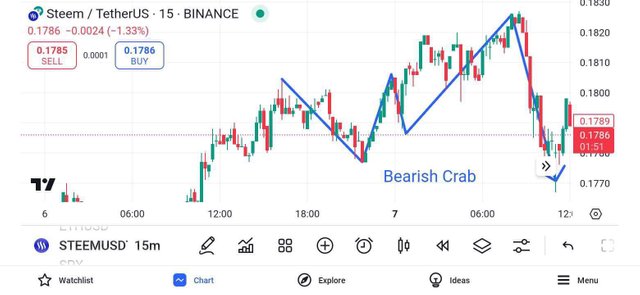
The next important thing which we should be focused on is to prevent stop loss.To the first very preventive stop loss should be at 3.6 Fibonacci extension. So once the market has been started in our favour this would be the completion of D leg.The next very important thing to see is where to take the profit. This is unfortunately one of the most volatile harmonic patterns.
The first profit that is about at the level of Fibonacci retracement of the CD leg. The second profit we can take is the breakage of A leg.If according to this Bearish crab harmonic pattern we can analyze that the market prices are going down.
Question 3: Applying Fibonacci to Harmonic Patterns
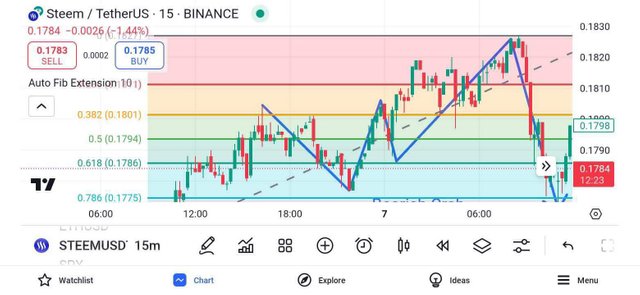
In Steem/USDT chart 📈 I have selected the fibonacci extension and I am going to draw this on bearish crab hormonic pattern.
In Steem/USDT chart 📈 I have selected the fibonacci extension and I am going to draw this on bearish crab hormonic pattern.
We need to focus on three things stop loss targets and set the profit. The breakpoint is 61.8.
We have three key level
- One in Golden line 0.382
- The green line 0.5
- The third one in blue is 0.618
You can clearly see the market restrict these levels most of the time in this chart if the market touches these levels it means the most probability is that the market price is going to high. But if a break occurs it means the probability will most likely market prices will be low.
Now I am demonstrating fibonacci retracement and extension level which are used in a harmonic pattern. These are some of the retracement levels and these are respectively
23.6% , 38.1% , 50.2% , 61.6% , 78.4%
Fibonacci extension levels which are respectively 125.1% , 161.6% , 200% , 261.6%
Fibonacci retracement and extension is a key indicator to identify reversal zones.
So why do we use fibonacci retracement and extension because both of these have separate functions retracement is mainly used to identify potential reversal zone whereas extensions in mainly the prediction about the market prices so when we combine together this is going to give us whole forecast price reversal. That's why we are using the retracement and extensions together.
Question 4: Trading Strategies with Harmonic Patterns
Strategy for steem token using the harmonic pattern. There are some rules which we need to follow firstly potential reversal in steem token with clear defined entry and exit point.
Entry point
Entry point you need to select any harmonic pattern I am using here the crab pattern. Then the selection of Fibonacci levels we must keep an eye on oversold/bought pattern which is divergence of RSI. Then must identify By MACD market prices prediction whether is is predicting about bullish or bearish pattern. Then afterwards finally you can enter and start trading.
Exit points
For exit you must need to take profit at your specific Extension level.You need to keep an eye on whether stop loss is going above or below the reversal level.
Risk solution
There are some rules for equity for example
There should be 5-6% equity of that account.
Open trading should be at least 3. And the level of stop loss we can set should be at least 7%-5% of account equity. One ratio we calculate for risk and reward ratios should be 1:5 or 1:3.
By following all these strategies step by step you can able to do technical analysis and you are able to see potential reversal zone in steem token by selecting harmonic pattern and alongside manage and solve all the risk
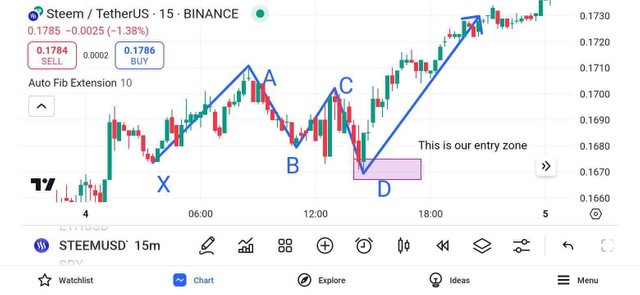
I am using Steem/USDT chart 📉 after the selection of indicator you can see I have highlight the five points A,B,C,D and X.
So I have highlight D is the entry point in this particular graph and in this graph there are two lower high and two lower lower formed. The true lower high points are A and C. A is a bit high and C is a bit down.Two lower low are B and D respectively.The second lower point is the entry point.
Question 5: Current Market Analysis Using Harmonic Patterns
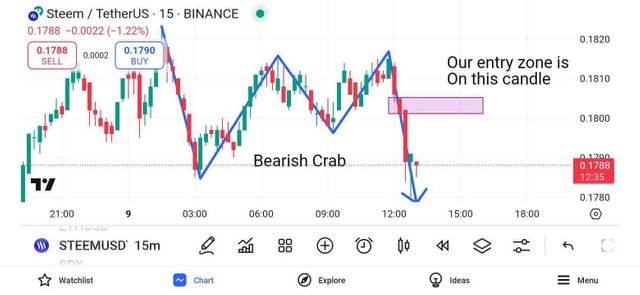
I am using Steem/USDT chart after the selection of harmonic pattern on bearish crab going to do the technical analysis for steem and forecast potential future price.
You can see according to this chart a bearish trend can be seen means the market prices for steem and crab is going to be down in future.
Another thing we just can predict but we are not 100% sure because there are so many factors upon which the prediction depends for example market prices are always volatile some extrinsic factor can affect the market prices another important thing is Fibonacci precision also plays an important role.
But harmonic patterns are going to play an important role to identify the reversal zone and another important factor which is stop loss level and market prices target.
And some factors can affect in a negative way for example if we rely on any false signal or pattern it is not correctly made.
But the good thing is that if we apply a harmonic pattern this is really going to help us with the market prices about our decision making capability and also about trading strategy.
All other charts images are taken from trading view.
This was all about my participation. I hope you like it and share your valuable comments. I would like to invite my friends @sahmie, @goodybest and @patejwell to share their participation.
Upvoted! Thank you for supporting witness @jswit.
Upvoted. Thank You for sending some of your rewards to @null. It will make Steem stronger.
Harmonic patterns have many parts that we already know. We are asked to present the particularly important ones. You have presented very nicely and shared them in different parts. Wish you all the best. Butterfly patterns are really amazing.
@ashkhan You have done an excellent job explaining harmonic patterns like the Butterfly Bat Gartley and Crab in such detail! Your breakdown of each pattern Fibonacci levels and how they relate to market reversals especially in the Steem/USDT pair is incredibly insightful. I appreciate how you illustrated the technical aspects with charts making it easier to grasp the concepts. Your emphasis on key points like stop loss and profit-taking strategies is helpful for traders.
Good luck with the contest
dear @ashkhan
Your analysis of the practical application of harmonic patterns in trading is well presented. The current state of the STEEM market and the prediction of future price growth is really good.
Good luck for the contest.